S17: MyAutoHealth
Contents
Grading Criteria
- How well is Software & Hardware Design described?
- How well can this report be used to reproduce this project?
- Code Quality
- Overall Report Quality:
- Software Block Diagrams
- Hardware Block Diagrams
- Schematic Quality
- Quality of technical challenges and solutions adopted.
MyAutoHealth
Real-time vehicle diagnostics.
Abstract
Wear and tear or aging of parts of an automobile may cause a malfunction which may lead to accidents, loss of life and property. Being able to pinpoint the issue in the automobile could be harder than actually fixing one. Most modern vehicles, just like a computer, have a central processing unit called the Engine Control Unit (ECU) which oversees all operations. This project aims to use an external OBD 2 module to communicate with the ECU using UART and display the status of all critical vehicle parameters to the user. This will enable the user to monitor the engine’s internal functioning. The module will suggest measures to improve driving efficiency and avoid damage. The module will also be used to analyze the driving habits of people, especially school bus drivers or those taking a driving test.
Objectives & Introduction
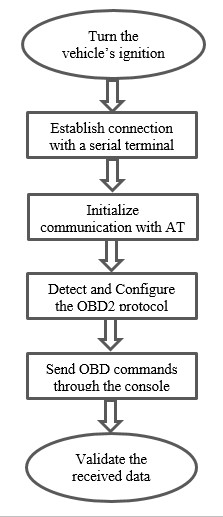
An OBD 2 module was used to communicate with the ECU of an automobile to read engine critical parameters. An LPC 1768 was used as the master for communication. The LPC node was powered using FreeRTOS. The master needed to issue a set of standard AT-commands to the OBD port. The LPC microcontroller doesn’t have the ability to communicate directly with an OBD port. Therefore, an intermediary communicator was used to facilitate smooth communication between the devices. The communicator was a UART to OBD fully-duplex converter. An OBD 2 port communicates with an ECU using CAN protocol. Therefore, in response to commands, an OBD terminal reads critical engine parameters like temperature, rpm, combustion efficiency, etc. from the ECU. The LPC master sent a byte of data to the OBD and in response to this command, the OBD terminal used CAN protocol to trans-receive a byte of data from the ECU. This byte was sent to the LPC. The master would then poll its registers to ensure that a valid byte is transmitted and received. Knowing the values of critical parameters can help a driver avert an engine seizure or prevent unforeseen accidents. The critical engine parameters were displayed on a LCD screen. The LPC master communicated with the LCD screen using I2C serial communication protocol. Care was taken to ensure that operating system queues were implemented efficiently to ensure that only after valid data was received from the OBD was it displayed on the LCD screen. An accelerometer was used for bump detection. A dedicated task was created to read z-axis values and analyze this data. Signal processing techniques were employed to make a decision whether a bump was detected or not. The z-axis values were normalized and the autocorrelation of the sequence was taken. The time domain autocorrelation function was transformed to its frequency domain equivalent. This result of this operation was the Power Spectrum Density of the signal. A thorough analysis of the spectrum was done to identify the signal. A decision was taken based on its pattern.
Team Members & Responsibilities
- Manan Mehta
- BOM, PCB design, and assembly
- Code testing and integration
- Interface accelerometer to obtain inclination and declination of vehicle.
- Pushpender Singh
- Interface OBD-II sensor to the SJOne Board over UART
- Acquire and translate ODB-II data to acquire engine load, vehicle speed, engine RPM and torque
- Sameer Saran
- Interfacing LCD Display
- LCD GUI design
- Integrating LCD, Accelerometer and OBDII code
- Sanman Pradhan
- PCB Design
- Main Wiki Report editor
- Shashank Iyer
- Bump detection using an accelerometer
- Using Signal Processing- FFT and PSD analysis to assess if the detected bump is valid
- Ensure critical section access is provided to all tasks created by team members.
Schedule
| Week# | Date | Task | Action |
|---|---|---|---|
| 1 | 03/21 | Research Project design and Finalize concept | Completed |
| 2 | 03/28 | Purchasing BOM and Assign Tasks | Completed |
| 3 | 04/04 | Developing C code to read Accelerometer readings | Completed |
| 4 | 04/11 | Interfacing OBD II sensor with SJ one board | Completed |
| 5 | 04/18 | Developing C code to retrieve data from Vehicle and PCB design | Completed |
| 6 | 04/25 | Integrating OBD and Sensor code into tasks and PCB design | Completed |
| 7 | 05/02 | Testing and debugging | Completed |
| 8 | 05/09 | PCB Assembly and Testing | Assembly- Completed, testing - In progress |
| 9 | 05/16 | Ready for Demo |
Parts List & Cost
A list of the cost of our project broken down by components.
| Item# | Part Desciption | Vendor | Part Number | Qty | Cost |
|---|---|---|---|---|---|
| 1 | SJOne Board | SCE | 1 | $80.00 | |
| 2 | OBD-II | SparkFun | WIG-09555 ROHS | 1 | $49.95 |
| 3 | OBD-II to DB9 Cable | SparkFun | CAB-10087 ROHS | 1 | $9.95 |
| 4 | uLCD Display | 4D Systems | uLCD-32PTU | 1 | $79.00 |
| 5 | SD card and Adapter for LCD | Amazon | SDSDQM-016G-B35A | 1 | $6.95 |
| 6 | FTDI Cable | SparkFun | DEV-09718 ROHS | 1 | $17.50 |
| 7 | PCB | PCBWay | N/A | 1 | $11.50 |
| 8 | SPDT Toggle Switches | Amazon | a14072300ux0371 | 10 | $8.83 |
| 9 | Li-po battery 3.7V 2000mAh | Adafruit | 2011 | 1 | $12.50 |
| 10 | Li-po battery charger | Adafruit | 2465 | 1 | $19.95 |
| Total | $227.77 |
Design & Implementation
The design section can go over your hardware and software design. Organize this section using sub-sections that go over your design and implementation.
Hardware Design
The following block diagram highlights the architecture of the project. 
Hardware Interface
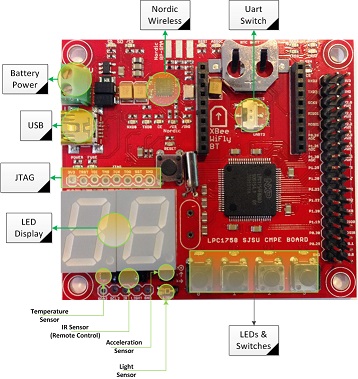 SJOne Board

UART Bus
Rx and Tx communication lines are used along with UART 2 connection which communicates between the SJOne board to UART. The "TXD2"(P0.10) and "RXD2" (P0.11)
of the SJOne Board interface with the OBD to UART board's RX-1 and TX-0.
I2C Bus Alternative, I2C 2 connection between the SJ One Board and the LCD Display SJ One Board pins P0.10 "SDA2" and P0.11 "SCL2" to LCD Display J2 pin4 "I2C data" and J2 pin4 "I2C clock". Observe that the pins interfere with the UART 2 connection so adaptation to a different UART port is necessary.
We also used a UART to OBD board for interfacing the board with the vehicle.

The power supply required was designed to be housed on a PCB. The following are the schematics of the board. EaglePCB was used for design and development of the PCB.


Software Design
ACCELEROMETER READING
The onboard accelerometer was used for gathering readings. The algorithm was designed such that if z-axis values were greater than a preset threshold then a bump event is triggered whereas if the readings were lesser in value than the threshold then no bump event is triggered.
The readings from the z-axis were normalized, this helped in easing the computations. The readings were stored according to the following steps
--> An array a[8] initialized to '0' used to store the normalized readings.
--> New readings are appended to the array while performing a simultaneous left shift operation.
--> If a bump is detected, the array will then have a value of a={0,0,0,0,0,0,0,1} whereas if no bump is detected, the array will have a new value of a={0,0,0,0,0,0,1,0}.
--> ADepending upon the movement of the vehicle there could be multiple '1's in the array, indicating multiple bumps.
BUMP DETECTION
This feature was added to enable monitoring a driver’s behavior. This could be widely used by schools to keep an eye on their drivers. An accelerometer was used to detect bumps. The accelerometer in the SJOne board was used to detect bumps in the vehicle travel path. The bump detection feature will also assist in mapping the driver's pattern and manner of driving. Depending upon the unevenness of the travel path, the LCD will display "No Bumps" or "Bump Detected". Accelerometer's z-axis value is read every 100 ms by creating a task.
The bump detection algorithm operates in the following manner:
1.Threshold value recognition to identify a preset value beyond which a bump will be detected
2.Values acquired by accelerometer sensor.
3.Acquiring Power Spectral Density(PSD) and analyze power spectrum.

Graphics LCD
We have used the uLCD-32PTU from 4D Systems. It’s a graphic LCD with a resolution of 240x320 which is very simple to use.

The LCD can be used for making quick GUI’s. We need the IDE which is available on the website to program the LCD. We can program the LCD using three methods:
1) ViSi Genie: This is a drag and drop mode. There are objects available in the menu which can be drag-dropped on the screen. These objects include switches, text boxes, gauges, thermometers, angular meters, etc. This mode doesn’t require any programming. Just like the name, it’s a genie. We use the object which we want and the IDE automatically generates the code required for it. We have used this mode for programming the LCD.
2) ViSi: This mode is a combination of the 4DGL programming language assisted with drag-drop of objects. Since we had a deadline to meet, we didn’t learn the 4DGL programming language. But this can be done if you have enough time.

3) Designer: This mode is a pure 4DGL programming language. Each object needs to add using the programming language. The only benefit of using this code is we can make use of the peripherals and busses available on the Touchscreen. The uLCD-32PTU has onboard I2C and UART ports and also has buzzer and ADC. We can make use of these functionalities by using the 4DGL programming language. These peripherals can also be used in the ViSi mode. Once you’ve made up your mind with the environment you wish to use (mostly you would go with the ViSi Genie environment), we will show you how to use the IDE and the LCD from scratch. 4D systems have very well documented app notes which can be found on this link: http:/www.4dsystems.com.au/appnotes/ Refer the app notes in the ViSi-Genie category.
Steps to program the LCD:
• Once the LCD is properly interfaced (you need to cross the Rx and Tx lines), goto “COMMS” tab and select the proper COM port and you should see the name of the LCD on the top left corner of the IDE. There would be a green symbol which means the IDE has detected the LCD.
• Press the “Copy/Build” button. NOTE: You would need a microSD card. The IDE stores the user images on the microSD. Even though we are not using any images, we still need a microSD card. The microSD should be formatted in FAT file format only.
• After the process is finished, the LCD won’t show our GUI unless we insert the SD card. It would keep flashing an error message.After inserting the SD card, our GUI would be up and running. Press the button, you can goto the next screen.
Interfacing this LCD with a host processor - SJOne Board.
• To interface LCD with the processor the UART port is used, which was initially used for programming the LCD. Cross connect the Rx and Tx pins of SJ-One board and the LCD.
• But to send the data on the LCD and specifically to objects like thermometers and gauges, we need to follow the specific frame format for the LCD. Remember the index which we talked about previously. We need to use those index numbers to address the object.
Testing & Technical Challenges
Describe the challenges of your project. What advise would you give yourself or someone else if your project can be started from scratch again? Make a smooth transition to testing section and described what it took to test your project.
Include sub-sections that list out a problem and solution, such as:
My Issue #1
Discuss the issue and resolution.
Conclusion
The whole setup was placed inside a Honda Civic for an acquiring relevant data. The readings from the accelerometer were documented and the values observed were passed as input for FFT calculation and PSD calculation, these values were further . We recorded accurate values and observed a steady pattern while driving
Project Video
Upload a video of your project and post the link here.
Project Source Code
References
Acknowledgement
We would like to acknowledge Professor Preet Kang for simplifying the concepts of FreeRTOS, clearing our doubts and guiding us with our coursework and project.
References Used
Adafruit website: https://learn.adafruit.com/pir-passive-infrared-proximity-motion-sensor/overview
Appendix
You can list the references you used.