S17: MyAutoHealth
Contents
MyAutoHealth
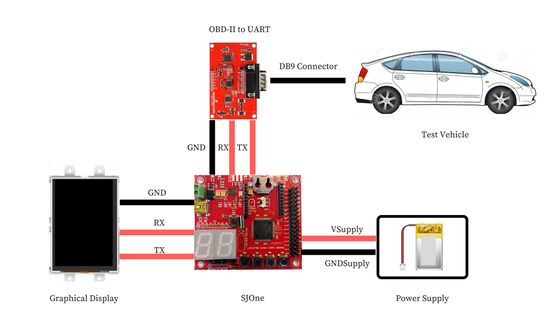
MyAutoHealth is a product that uses various parameters of a vehicle and an accelerometer sensor to inform the driver of how well a vehicle is being driven. Below is a system diagram to show how the various modules interact.
Abstract
Wear and tear or ageing of parts of an automobile may cause it to malfunction and this may lead to accidents and loss of life and property. Therefore, it is important to monitor a vehicle's internal systems continuously and report any spurious activity to the driver. Most modern vehicles, just like a computer, have a central processing unit called the Engine Control Unit (ECU). This microcontroller oversees all operations. The project uses an OBD 2 module to communicate with the ECU and display the status of all critical vehicle parameters to the driver. This will enable the driver to monitor the engine’s internal functioning. The module will suggest measures to improve driving efficiency and avoid accidents and damage. It will keep an eye on the engine to see if the instantaneous load on it is more than it can handle and warn the driver if so. This will provide real-time feedback to the driver and ensure that appropriate steps can be taken preemptively to avert any major accidents. The module also track the driver's habits. A bump detection algorithm has been developed using deterministic signal processing that the user can turn on to monitor himself or herself.
Objectives & Introduction
The main objectives of this project are as follows:-
- Develop a standalone system to communicate with the ECU
- Monitor critical engine parameters
- Measure road inclination against the vehicles torque-speed characteristics
- Detect careless driving habits using signal processing
- Display vehicle parameters and provide real-time updates about the same on a LCD screen
Team Members & Responsibilities
- Manan Mehta
- BOM, PCB design, and assembly
- Code testing and integration
- Interface accelerometer to obtain inclination and declination of vehicle.
- Pushpender Singh
- Interface OBD-II sensor to the SJOne Board over UART
- Acquire and translate ODB-II data to acquire engine load, vehicle speed, engine RPM and torque
- Integrating OBD2 code with and accelerometer code- worked with Shashank Iyer
- Sameer Saran
- Interfacing LCD Display
- LCD GUI design
- Integrating Display code to OBDII and accelerometer code
- Sanman Pradhan
- PCB Design
- Edit the Wiki Report
- Shashank Iyer
- Bump detection using an accelerometer
- Using Signal Processing- FFT and PSD analysis to assess if the detected bump is valid
- Ensure critical section access is provided to all tasks created by team members.
Schedule
| Week# | Date | Task | Action |
|---|---|---|---|
| 1 | 03/21 | Research Project design and Finalize concept | Completed |
| 2 | 03/28 | Purchasing BOM and Assign Tasks | Completed |
| 3 | 04/04 | Developing C code to read Accelerometer readings | Completed |
| 4 | 04/11 | Interfacing OBD II sensor with SJ one board, LCD Communication Protocol setup | Completed |
| 5 | 04/18 | Developing C code to retrieve data from Vehicle and PCB design, LCD GUI Design | Completed |
| 6 | 04/25 | Integrating OBD and Sensor code into tasks and PCB design, LCD hex Codes Integration | Completed |
| 7 | 05/02 | Testing, troubleshooting, debugging and optimization | Completed |
| 8 | 05/09 | PCB Assembly and Testing | Completed |
| 9 | 05/16 | Ready for Demo | Absolutely! |
Parts List & Cost
A list of the cost of our project broken down by components.
| Item# | Part Desciption | Vendor | Part Number | Qty | Cost |
|---|---|---|---|---|---|
| 1 | SJOne Board | SCE | 1 | $80.00 | |
| 2 | OBD-II | SparkFun | WIG-09555 ROHS | 1 | $49.95 |
| 3 | OBD-II to DB9 Cable | SparkFun | CAB-10087 ROHS | 1 | $9.95 |
| 4 | uLCD Display | 4D Systems | uLCD-32PTU | 1 | $79.00 |
| 5 | SD card and Adapter for LCD | Amazon | SDSDQM-016G-B35A | 1 | $6.95 |
| 6 | FTDI Cable | SparkFun | DEV-09718 ROHS | 1 | $17.50 |
| 7 | PCB | PCBWay | N/A | 1 | $11.50 |
| 8 | SPDT Toggle Switches | Amazon | a14072300ux0371 | 10 | $8.83 |
| 9 | Li-po battery 3.7V 2000mAh | Adafruit | 2011 | 1 | $12.50 |
| 10 | Li-po battery charger | Adafruit | 2465 | 1 | $19.95 |
| Total | $296.13 |
System Development and Hardware Design
The device was designed to operate standalone so that its working didn't depend on the availability of a free power port in the vehicle. A lithium ion battery was chosen as the power source. The device needed to be connected with the OBD port in the vehicle for all features to be available or just be placed on a flat surface inside the vehicle to enable some features.
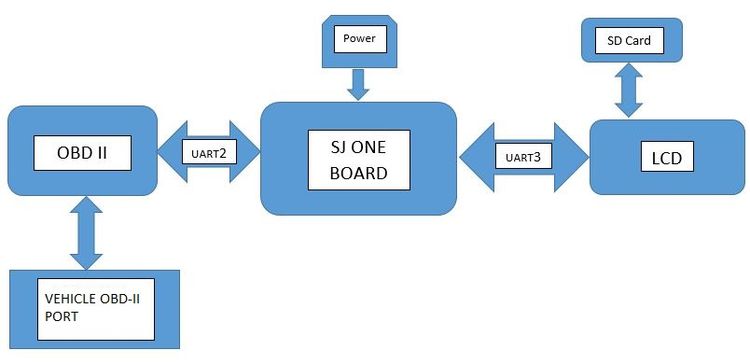
An LPC 1758 microcontroller was used as the master for this system. The master communicated with:
- An OBD II terminal over UART to read critical vehicle parameters
- A LCD screen over UART to display real time values to the drivers
- An onboard accelerometer using I2C to monitor driving habits and warn the driver about possible accidents.
The block diagram provides an overview of the system's architecture.
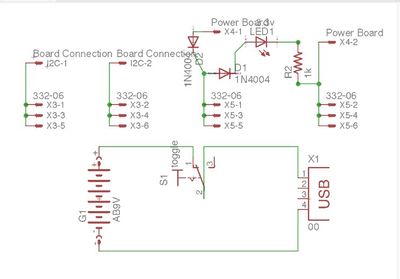
The lithium ion battery was to power the master and all peripheral devices. A current distribution circuit was designed and manufactured to enable this. Autodesk EAGLE 8.1.1 was the tool of choice to design the PCB's layout.
Designing the PCB in EAGLE is a two step process:
- Schematic Designing: A current distribution footprint was created. Prototyping components by Adafruit and Sparkfun were used for the battery charging circuit and the USB to serial communicator. Therefore, PCB designing libraries developed by these firms were downloaded and integrated with EAGLE to enable accurate footprint creation.
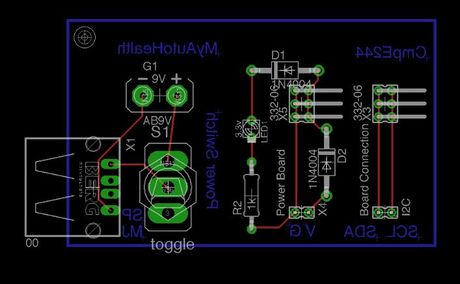
- Board Designing: The schematic design offered an overview of the board with a black grid and the components clustered at one end. The components were rearranged to avoid any short circuits that could have been caused due to the proximity of tracks or contacts. ERC (Electrical Rule Check) and DRC (Design Rule Check) checks followed. Solder masks were added for protection.
The circuit's layout is as follows:
.
Monitoring Engine Parameters
OBD is the language of ECU that has been designed to detect system failures. This OBD2 standard was used to communicate with the ECU to acquire data about all critical engine parameters. This data was sent to the master over UART.
OBD2 trans-receives bytes of data with the ECU. Some of the OBD2 commands used are:
engineLoad= "0104", fuelPressure = "010A" engineRpm = "010c", vehicleSpeed = "010d"
The interpretation of the bytes of data are as follows.
- Suppose the master wanted to access engine RPM. It would send “010c”.
- The first hex pair represents the OBD mode and the second hexadecimal represents the PID(Parameter Identification).
- In this example, Mode 01 and Pid 0c is used which returns the engine RPM.
The master will receive bytes of data and will have to interpret it. When “010c” is sent the master will receive a string of hexadecimal numbers: 41 0C 03 2E. 0x41 - State of board in mode one 0x0C - RPM parameters 0x03 and 0x2E, values used to calculate the RPM.
Testing:
- The ODB2 module was interfaced with the master with an OBDII to uart converter.
- An FTDI chip was used to allow communication with a pc.
- Baud rate was set to 9600 bps and USB driver was configured to 8 data bits, 1 stop bit and no parity bit.
- ATZ or init command was sent. If all connections are correct the master will receive "ELM327 v2.0".
Implementation:
- The AT commands were sent to the OBD terminal.
- Another string was obtained in response to these commands. The data was converted to integers for displaying.
Driving habits and signal processing
BUMP DETECTION
This feature was added to enable monitoring a driver’s behavior. This could be used widely by schools to keep an eye on their drivers. An accelerometer is used to detect bumps in the vehicle path. Depending on the unevenness of the travel path, the LCD will display "No Bumps" or "Bump Detected". The accelerometer's z-axis value is read every 100 ms by creating a task.
The bump detection algorithm operates in the following manner:
1. Threshold value recognition to identify a preset value beyond which a bump will be detected
2. Acquiring values from the accelerometer.
3. Using signal processing to obtain its Power Spectrum Density.
4. Analyzing the power spectrum of the signal.
ACCELEROMETER READING
The onboard accelerometer was used for gathering readings. The algorithm was designed such that if z-axis values were greater than a preset threshold then a bump event is triggered whereas if the readings were lesser in value than the threshold then no bump event is triggered.
The readings from the z-axis were normalized, this helped in easing the computations. The readings were stored according to the following steps
--> An array a[8] initialized to '0' used to store the normalized readings.
--> New readings are appended to the array while performing a simultaneous left shift operation.
--> If a bump is detected, the array will then have a value of a={0,0,0,0,0,0,0,1} whereas if no bump is detected, the array will have a new value of a={0,0,0,0,0,0,1,0}.
--> Depending upon the movement of the vehicle there could be multiple '1's in the array, indicating multiple bumps.
SLOPE AND BUMP DETECTION
If the road on which the car was moving was inclined, then it was observed that the z-axis readings would cross the threshold. But these events were not to be considered as bumps. The algorithm was to be designed to ensure that it didn’t consider the occurrence of such an event a bump. Some examples of cases that needed differential treatment are as follows:
--> The array a in case the vehicle in ascending a slope will have values like a={0,1,1,1,0,0,0,0}.
--> If the vehicle has climbed a slope and after this, due to negligent driving passes over a bump, then the array’s value could be a={0,1,1,1,1,0,1,0}.
To be able to distinguish between the two cases and make a decision that there is no bump in the first case and a clear bump in the second, signal processing was used. The array a needed to possess certain characteristics so that the signal processing techniques could produce a meaningful output.
WIDE SENSE STATIONERY SIGNAL
To analyse the power spectrum density of an array, it must be WSS or Wide Sense Stationery. The array a:
- Has a constant mean from which instantaneous values may deviate but will eventually return to:
m(n)=m
If the mean deviates from the constant value, then the equation indicates that at some time n the mean m(n) will return to its constant value m.
- The autocorrelation depends only on the difference (k-l) and is given as:
r(k,l)
- The normalised values from the z-axis have a value of either ‘1’ or ‘0’. Thus the variance of any new reading from the accelerometer from the previous value can be utmost ‘1’. The variance is given by c(n) and its value must be:
c(n)<∞
Since all three conditions are satisfied, the array a is WSS. To obtain the PSD of a wide sense stationery array, the following procedures are followed:
--> The autocorrelation sequence of the array is calculated.
--> It is transformed to its frequency domain equivalent using Fast Fourier Transform which has a running time of O(nlogn).
--> The Fourier Transform of the autocorrelation sequence is the Power Spectrum Density of the Signal.
AUTOCORRELATION
The autocorrelation sequence of the sequence is obtained using matrix multiplication and then summing up the lower triangular elements. This process reduces the time complexity by a fourth as compared to the traditional approach. The autocorrelation matrix R is computed by multiplying the array with it’s transpose. The elements of the matrix are as follows:
r= (1,1) (1,2) ⋯ (1,8)
   (2,1) (2,2) ⋯ (2,8)
     ⋮      ⋮   ⋱   ⋮
   (8,1) (8,2) ⋯ (8,8)
Each element of the autocorrelation matrix is obtained by:
--> Summing up all the elements along the right diagonal upto the left diagonal.
--> This summation is multiplied by two.
--> The element on the left diagonal is added to the summation.
An example of this operation is as follows:
--> For an even index, the value of the autocorrelation is
r(2)=r(2,1)*2.
--> For an odd index, the value of the autocorrelation is
r(3)=(r(3,1)*2)+r(2,2)
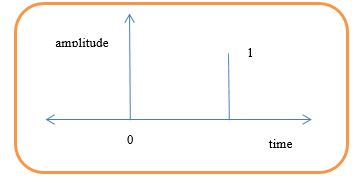
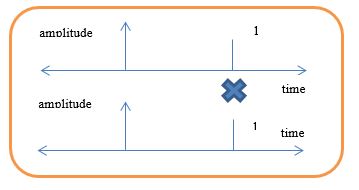
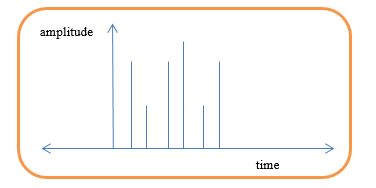
The value of the array when a bump is detected is a={0,0,0,0,0,1,0,0}. This is an impulse signal.
This impulse signal is displayed in the adjoining image:
The autocorrelation of this unit impulse response signal is the signal itself. This is shown in the following image:
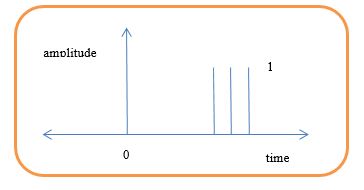
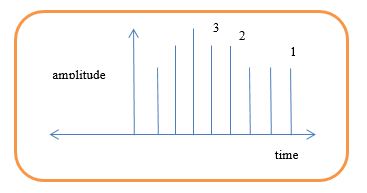
If no bumps are detected but the vehicle is either ascending or descending a slope, the value of the array is a={0,0,0,1,1,1,0,0}. This is a rectangular pulse of unit height. The rectangular pulse is displayed below:
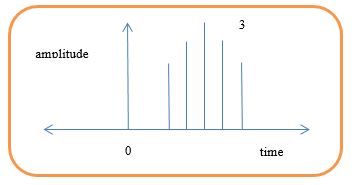
The autocorrelation of this rectangular pulse is a triangular pulse:
Based on the visual analysis, it is clear that if a triangular pulse is present in the autocorrelation sequence, the vehicle is probably on a slope and therefore the z-axis values do not indicate a bump.
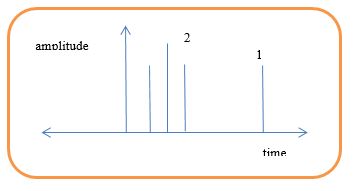
If the input array has a sequence like a={0,0,1,1,1,0,1,0}, then the autocorrelation sequence obtained will look like:
The autocorrelation sequence is completely distorted in this case and thus it is evident that the vehicle went over a bump.
If the array’s value is a={1,1,0,0,0,0,0,1}, the autocorrelation sequence obtained will have both a triangular pulse and an impulse both clearly separated as follows:
Power Spectral Density
The PSD of the autocorrelation array was analysed. This helped in making a decision if a valid bump was detected. The PSD analysis helped overcome most of the drawbacks that an analysis of the autocorrelation array would have resulted in.
The frequency domain representation of an autocorrelation WSS signal is its power spectrum. The following cases were observed while analyzing various inputs:
- If no bumps were detected at all and if the vehicle was moving on a flat road, the array sequence had only zeros. Therefore, its autocorrelation sequence was also zero and its power spectrum was flat with amplitude zero.
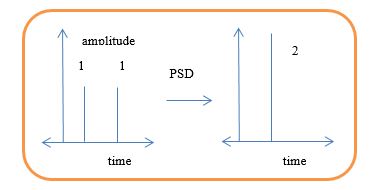
- If single or multiple bumps occurred, the autocorrelation array would consist of impulse response functions. The Power Spectrum Density of such a signal was an impulse whose magnitude was the sum of the magnitudes of all the impulses. No phase shift was observed in this case. A plot representing the PSD of two bump signals is shown in the figure below.
- If the car was moving uphill or downhill, then the autocorrelation sequence was a triangular pulse. The Fourier Transform of this pulse is a sinc-squared function. This is as shown below:
- The amplitude of this sinc-squared function is the amplitude of the triangular pulse times its width. The function detection program checked the value of the amplitude. It also checked for zero crossing. If both these conditions were present in the PSD, then a decision was made that there was no bump.
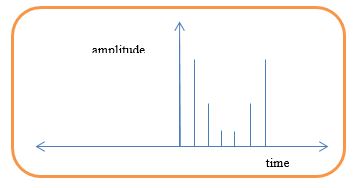
- If the autocorrelation sequence has both a triangular pulse and multiple impulses, the PSD will be distorted as shown below:
The Display
The critical engine parameters were displayed on a LCD screen to provide real time updates to the driver.
LCD Graphical User Interface Design
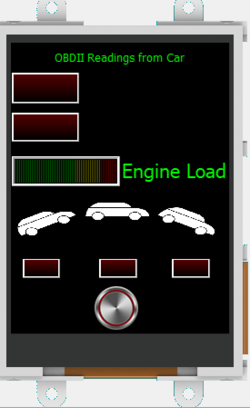
The LCD display displayed the following the parameters:
- The orientation of the vehicle- Incline, Decline, Horizontal
- The total load on the engine.
- Careless driving behaviour by displaying 'Bump Detected'
- If the vehicle is at an incline and the vehicle speed is reducing, it prompts the driver to accelerate. If the vehicle torque is not increasing with acceleration it sounds an alarm bell.
- If the vehicle is at an decline and the vehicle speed is increasing, it prompts the driver to decelerate.
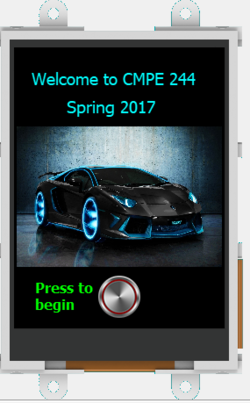
An image displaying the LCD's output is as follows:
The LCD was programmed as follows:
- ViSi Genie: This is a drag and drop mode. Objects available in the menu were added to the screen. These objects included switches, text boxes, gauges, thermometers, angular meters, etc.
- ViSi: This mode is a combination of the 4DGL programming language assisted with drag and drop of objects.
- Designer: This mode is a pure 4DGL programming language. Each object needs to be added.
The LCD module worked as follows:
- The LCD sends in acknowledgment to the LPC node once it receives the device ID
- The LCD acknowledges that the register address has been sent and communication to begin writing data starts.
Future Developments
There is ample of data available over the OBD-II tools and along with many more sensors we can diagnose more in depth about the various parameters of a vehicle.This information can help the driver to know more about his/her driving skills and about the vehicle's conditions.
Testing & Technical Challenges
Issue 1
We had created multiple producers and consumers to share information between tasks. A specific task was created to read values from the accelerometer, another to normalize the data and a third to perform signal analysis. We noticed that there was an issue with context switching and that the tasks weren't running synchronously. It was noticed that at least one task was getting blocked forever although they were all of the equal priority.
Resolution
This problem was solved by forcing a producer to sleep for a fixed duration.
Issue 2
We had another set of tasks that needed to access the LCD screen to display data. We noticed that there was bus contention when multiple tasks tried to access the UART2 ports.
Resolution
We overcame this issue by integrating all LCD write calls into a separate task and gave it a semaphore. It would thus print on the LCD screen after all other tasks had finished updating the variables to be printed.
Issue 3
While working on the OBD-II to SJOne communication to retrieve the data from each incoming OBD-II frame, we were missing some of the data and the OBD-II would return a fault in the system signal
Resolution
We tried various methods to solve the issue such as mutex to prevent multiple accesses to the bus and queues to wait for a task to complete one transaction before starting another but the easiest solution was to sleep the task for a short duration to allow for the OBD-II tool to process our PIDs and respond with the appropriate values.
Issue 4
Since most of the data from the OBD-II frames required bit manipulation and mathematical formulas to decode we had to make multiple trips to the car to run and test our program
Resolution
We broke the mathematical conversions and bit manipulation programs into smaller functions and created and tested those functions on Xcode (you can use any IDE to compile C/C++ programs) so as to reduce debugging time and reduce our trips to the car.
Conclusion
The whole setup was placed inside a Honda Civic for an acquiring relevant data. The readings from the accelerometer were documented and the values observed were passed as input for FFT calculation and PSD calculation, these values were further . We recorded accurate values and observed a steady pattern while driving
Project Video
Project Source Code
References
Acknowledgement
We would like to acknowledge Professor Preet Kang for simplifying the concepts of FreeRTOS, clearing our doubts and guiding us with our coursework and project.
References Used
[1] CMPE 244 Lecture notes from Preetpal Kang, Department of Computer Engineering, San Jose State University (Spring 2017)
[2] SparkFun Website: https://learn.sparkfun.com/tutorials/obd-ii-uart-hookup-guide
[3] SocialEdge Website: http://www.socialledge.com/sjsu/index.php?title=Main_Page
[4] Hayes, M. (2002). Statistical Digital Signal Processing and Modelling. Singapore: John Wiley & Sons (Asia) Pte. Ltd.
[5] OBD-II PIDs (Wikipedia) :https://en.wikipedia.org/wiki/OBD-II_PIDs
[6] LCD Start-Up Guide: http://www.4dsystems.com.au/productpages/uLCD-32PTU/downloads/uLCD-32PTU_productbrief_R_1_2.pdf
[7] LCD Screen Datasheet: http://www.4dsystems.com.au/productpages/uLCD-32PTU/downloads/uLCD-32PTU_datasheet_R_2_1.pdf
