Difference between revisions of "S14: Android based home monitoring system"
Proj user4 (talk | contribs) (→Testing & Technical Challenges) |
Proj user4 (talk | contribs) (→Software Design) |
||
| Line 154: | Line 154: | ||
Figures (Fig 3 and Fig 4 )give an overview of the individual components. | Figures (Fig 3 and Fig 4 )give an overview of the individual components. | ||
[[File:CmpE244 S14 AHMS Device Driver.jpg|300px|thumb|center|Fig 4. Device driver flowchart]] | [[File:CmpE244 S14 AHMS Device Driver.jpg|300px|thumb|center|Fig 4. Device driver flowchart]] | ||
| + | |||
*Android application is implemented in three parts: | *Android application is implemented in three parts: | ||
| Line 186: | Line 187: | ||
'''Application GUI''' | '''Application GUI''' | ||
| − | Start app development by changing the main.xml file to add buttons as seen in the layout in figure( | + | Start app development by changing the main.xml file to add buttons as seen in the layout in figure(10) , add the corresponding stings in the string.xml file. This project uses the buttons to send a particular character when clicked. To do this change the BluetoothChat.java file as follows by adding the following lines of code in the setupChat() function. |
| Line 204: | Line 205: | ||
● Graphing method | ● Graphing method | ||
| − | + | [[File:CmpE244 S14 AHMS XYplotcode.jpg|400px|thumb|right|Fig 12. XYplotcode]] | |
| − | + | :Our graphics are primarily based on the library “androidplot” downloadable from (www.androidplot.com) | |
| − | + | :AndroidPlot is a very powerful package to plot graphs. The input for graphing method are two arrays of type Number. To plot an XY graph, these numbers are converted to XY-Series data type and use a LineandPointFormatter class. Once X-axis plane is fully plotted, another series will be used to plot Y- axis plane. | |
'''Application configuration''' | '''Application configuration''' | ||
Revision as of 21:14, 22 May 2014
Contents
Grading Criteria
- How well is Software & Hardware Design described?
- How well can this report be used to reproduce this project?
- Code Quality
- Overall Report Quality:
- Software Block Diagrams
- Hardware Block Diagrams
- Schematic Quality
- Quality of technical challenges and solutions adopted.
Android based home monitoring system
Abstract
The home monitoring system is designed to monitor light and temperature of different rooms. The monitoring system will monitor light and temperature of different rooms and report the status to the user via an android application.
Features
- Light and temperature monitoring of multiple rooms
- Android application to view status of sensors
Team Members
- Om Narasimhan
- Software design and Android App development
- Aysha Malik
- Hardware interface design and integration
- Sri Latha Ayyannagari
- FreeRTOS driver design and development
Schedule
| Sl. No | Start Date | End Date | Task | Actual |
|---|---|---|---|---|
| 1 | 2/28 | 2/28 | Order Components and Make a schedule | Completed) |
| 2 | 3/1 | 3/10 | Components Procurement. | Completed (03/06/2014) |
| 3 | 3/6 | 3/6 | Identify tasks assign work | Completed (03/06/2014) |
| 4 | 3/6 | 3/13 | Study about bluetooth module and its interfacing | Completed |
| 5 | 3/6 | 3/13 | Learn application development using Android, Complete hardware interfaces | Completed |
| 6 | 3/13 | 3/18 | Finish software design and conduct reviews | Completed |
| 7 | 3/18 | 4/8 | Develop App to establish communication b/w bluetooth device android device, Add component in app to discover available devices,Develop SPP emulator for android app | Completed |
| 8 | 4/8 | 4/18 | working on developing data transfer protocol and communicating with multiple devices at the same time | In progress |
| 9 | 4/18 | 4/25 | Integrate code and start testing | Not yet started |
| 10 | 4/25 | 4/30 | Resolve issues if any | Not yet started |
| 10 | 4/30 | 5/3 | Final Testing | Not yet started |
Parts List & Cost
| Qty | Description | Manufacturer | Part Number | Total Cost |
|---|---|---|---|---|
| 3 | SJOne Board | SJSU | - | $240.00 |
| 3 | 2013 Bluetooth Master UART Board Communication Module- 4 Needle Blue | $22.50 | ||
| 1 | Samsung Galaxy S4 | Samsung | - | |
| Total Cost | ! |
Design & Implementation
The project was completed in a number of steps
1. Device driver development
2. Android Application development
Hardware Design
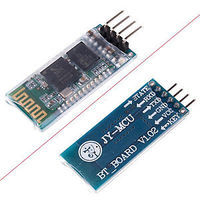
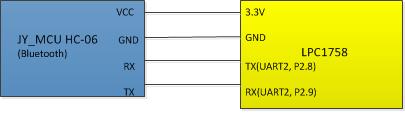
Basic Bluetooth module (JY-MCU HC-06) was purchased from ebay for $8 including shipping. This particular series (HC-06) has four pins RX, TX, VCC and GND and can only work in slave mode. The module specification mentions that the module can be reprogrammed, but the KEY and STATE pins are not available in this series (HC-06).
Note: Although VCC pin indicates that the module works with 3.6-6V, connecting it to the LPC1758 3.3V output worked fine.
Hardware Interface
This project uses UART2 for communication.The default setting for UART is: Baud Rate - 9600, no parity, one start bit and one stop bit.
Software Design
Parameters are monitored by devices placed in each room. The monitoring device communicates to android application using Bluetooth. The application records incoming data from different devices and continuously analyses it. Interpretation of the data can either be done in real time or at fixed intervals and logical decisions are taken (e.g, no motion sensor update for X minutes, so switch off lights, or based on the historical data, switch on lights at a particular time ..etc)
In this project software design has two components: device driver and android application.
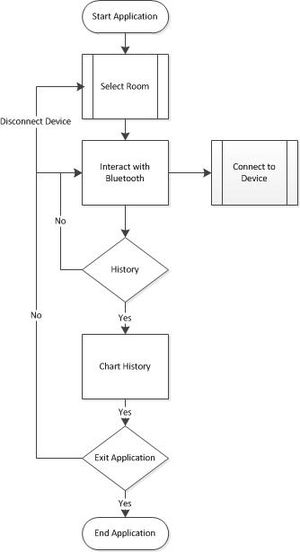
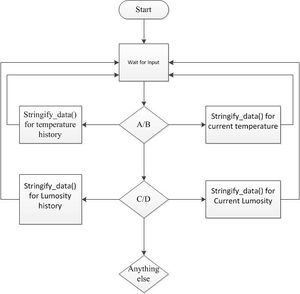
Figures (Fig 3 and Fig 4 )give an overview of the individual components.
- Android application is implemented in three parts:
- 1. Start Screen
- Enable Bluetooth
- Upon selection of Room connect to the corresponding device
- 2. Communication Screen
- Once connection is established, status is shown as connected or a message “connection failed”
- Send characters for information request and display incoming data
- Current Temperature
- Temperature History
- Current Lumosity
- Lumosity History
- 3. Graphing Screen
- Plot the requested weather data.
- Free RTOS application is implemented in two parts
- 1. Data Structure
- Every board gathers temperature and Luminosity samples at fixed intervals. The interval is configurable and was set at 5sec
- 2. Data gathering and transfer Protocol
Android application development
First thing to do before application development is to install the tools needed. We downloaded the Android SDK and followed the instructions for tool setup in this tutorial. (https://developer.android.com/sdk/index.html) Second thing to get started on android development is to understand the android development environment we used this tutorial (https://developer.android.com/training/index.html) for building and run the first application.
It is very hard for anyone without the knowledge of Java and Xml to write an application from scratch. For this reason we used the Bluetooth Chat sample code provided in the Android SDK package as a starting point for this project.
Application GUI
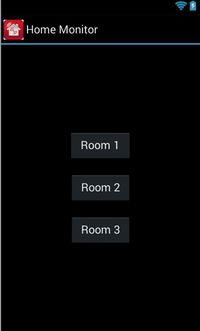
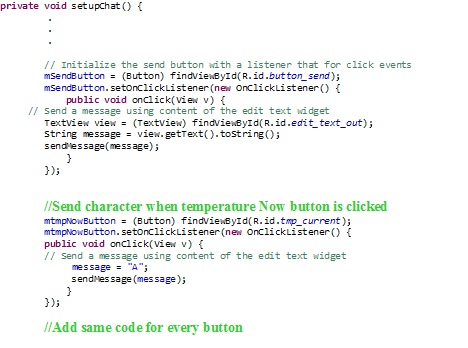
Start app development by changing the main.xml file to add buttons as seen in the layout in figure(10) , add the corresponding stings in the string.xml file. This project uses the buttons to send a particular character when clicked. To do this change the BluetoothChat.java file as follows by adding the following lines of code in the setupChat() function.
● The first screen for application is for home station selection
As you can see in the screen shot, there are three buttons to select among three home stations. Upon selecting a weather station (denoted by “roomX”, X => 1, 2, and 3), the application establishes a connection to the Bluetooth agent in the weather station. Once connection is established, the status is shown to the user as “connection established” or “connection failed”
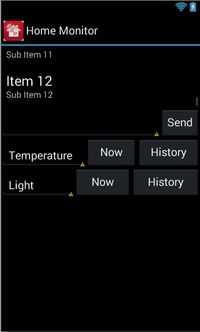
● There are 4 different buttons viz,
- Temperature Now (Read the current temperature) History (Historical temperature data and graphs)
- Light Now (Read the current luminosity) History (Historical luminosity data and graphs)
● Graphing method
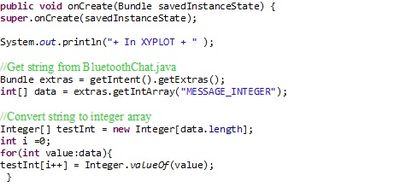
- Our graphics are primarily based on the library “androidplot” downloadable from (www.androidplot.com)
- AndroidPlot is a very powerful package to plot graphs. The input for graphing method are two arrays of type Number. To plot an XY graph, these numbers are converted to XY-Series data type and use a LineandPointFormatter class. Once X-axis plane is fully plotted, another series will be used to plot Y- axis plane.
Application configuration
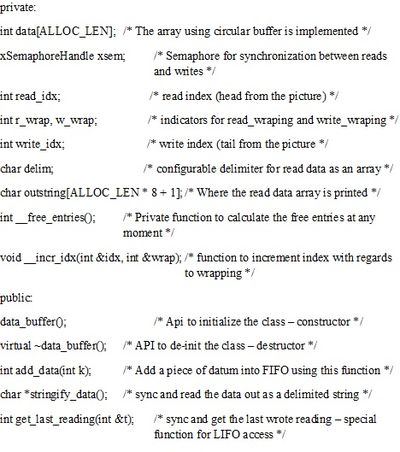
In main, we have instantiated two variables (one for Temperature and another for Luminosity) of type data_buffer with a buffer size 100 entries. We setup a thread to read the sensors at periodic intervals and fill into the corresponding buffers. By virtue of our data structure, maximum space allocated for readings are bound at the init time.
Data Analysis
The gather_tmplight() thread wakes up at intervals and fills in the data into the buffer. The Android app can query any device either for a. Last wrote data, or b. Complete history (upto 100 entries).
Data structures
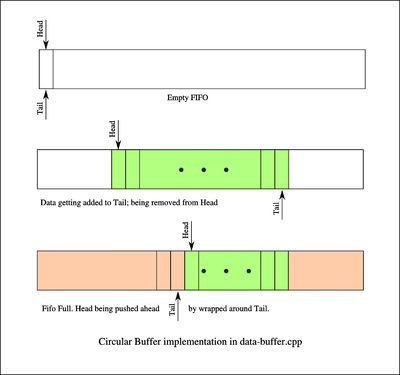
Every board gathers temperature and Luminosity samples at fixed intervals. The interval is configurable and default is set at 5sec. Initially, our first choice was to use a FIFO for storing these readings. But then, it became very difficult to discard older entries. Although we planned to have a timeout mechanism associated with every entry, later we figured out that a FIFO implementation based on a circular buffer would be easier to implement and maintain.
Here is a graphical representation of our FIFO based on a circular buffer.
Communication protocol
The transaction is carried out using the following protocol:
| S.NO. | Message type | Description |
|---|---|---|
| 1 | Query last wrote data – temperature | The application will write the character 'A' to the Bluetooth agent. The device's uart read/write thread wakes up and reads the input character 'A'. It calls the stringify_data() method of the temperature buffer for last read data which is printed out with the set delimiter (default : $) |
| 2 | Query last wrote data – Luminosity | The application will write the character 'C' to the Bluetooth agent. The device's uart read/write thread wakes up and reads the input character 'C'. It calls the stringify_data() method of the luminosity buffer for last read data which is printed out with the set delimiter (default : $) |
| 3 | Query historical data – temperature | The application will write the character 'B' to the Bluetooth agent. The device's uart read/write thread wakes up and reads the input character 'B'. It calls the stringify_data() method of the luminosity buffer for all data in the history buffer. Resulting string, a $ delimited character array of all readings will be written to the uart. The application will read this array and convert them to numbers and input to the graphing function. |
| 4 | Query historical data – Luminosity | The application will write the character 'D' to the Bluetooth agent. The device's uart read/write thread wakes up and reads the input character 'D'. It calls the stringify_data() method of the luminosity buffer for all data in the history buffer. Resulting string, a $ delimited character array of all readings will be written to the uart. The application will read this array and convert them to numbers and input to the graphing function |
| 5 | Any other query | Result in a single string “-01:-02” |
Implementation
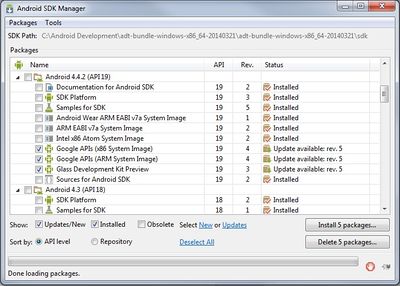
The sample code is downloaded using the Android SDK Manager. From the navigation menu of the IDE go to Windows -> Android SDK Manager. All the installed and available SDK packages are listed; attention should be paid to the version of SDK platform. It should be the same as the Android version of your device. This project is developed using Android 4.2.2.(kitkat), API level 19. After this sample code can be found in the folder sdk->samples->android-19->legacy on the host machine. Import the Bluetooth Chat sample in to the project workspace.
Next step is to establish communication with the LPC1758 using Bluetooth Chat sample application. Bluetooth sample is not a functioning application; this tutorial (http://www.instructables.com/id/Android-talks-to-Arduino/?ALLSTEPS) provided the solution to the problem. It said to change the UUID in BluetoothChatService.java file to “00001101-0000-1000-8000-00805F9B34FB”
Once the change is made this application is able to communicate with LPC1758. In this project android application is composed of three activities: BluetoothChat.java, Avtivity_main.java and SampleXYPlotActivity.java.
Testing & Technical Challenges
Testing
Install the app BlueTerm on your android device. This app is a terminal emulator, and uses RFCOMM/SPP protocol for serial communication over Bluetooth. It is used to establish connection between LPC1758 and android device. The JY-MCU Bluetooth module appears as linvor in the available device list. Once the connection is established send a character from LPC1758 using Hercules, you should now be able to see the character appear on the terminal. Now send a character from the android device and it should appear on the Hercules terminal. This verifies the communication between LPC1258 and android device.
Challenges
Data structures implementation: Initially we toyed with the idea of every reading will be stored with a timeout value. But soon it became apparent that it is not a scalable solution. So, we searched for an alternative and finally came up with a Circular Buffer based FIFO. Initially we tried storing both temperature and luminosity in the same data structure. But later it became so cumbersome that we decided to simplify code using two separate instances of the same data structure. Graph plotting was considered difficult till we came across Androidplot libraries.
Difficulty with testing: The state machine designed was to wait till a suitable input. In order to simplify testing, we implemented a command (to be input from the prompt) using a terminal task. Thus, by connecting uart2 to uart3 we could independently verify the functionality of the device – by reading the temperature value and history as well as Luminosity value and history.
Conclusion
Conclude your project here. You can recap your testing and problems. You should address the "so what" part here to indicate what you ultimately learnt from this project. How has this project increased your knowledge?
Project Video
Upload a video of your project and post the link here.
Project Source Code
Send me your zipped source code and I will upload this to SourceForge and link it for you.
References
Acknowledgement
Any acknowledgement that you may wish to provide can be included here.
References Used
Appendix
You can list the references you used.
