S12: Sound Reader
Contents
Sound Meter
Abstract
The CMPE 146 Embedded System Final Project consisted of constructing a sound meter. A device audio output signal will travel through a band pass filter and level shifter. The output signal from the level shifter is then read into the ADC on the LPC2148 microcontroller. Depending on the Analog-to-Digital Converter (ADC) value LED’s are turned on to display the bass response. Using a 16- channel PWM driver with serial interface each LED is independently controlled to a configurable 12- bit intensity control.
Objectives & Introduction
The objective is to create a sound meter.
- Create Band Pass Operational Amplifier
- Create Level Shifter Operational Amplifier
- Interface output audio signal with LPC2148
- Interface SPI communication between microcontroller and TLC5940
Team Members
- John Leone
- Jose Martinez
- Jose Villanueva
Roles & Responsibilities
| Name | Role | Responsibilities |
|---|---|---|
| John Leone | Leader | Programmer/Designer |
| Jose Martinez | Assistant Hardware Designer | Hardware Design/Hardware Testing/Fixture |
| Jose Villanueva | Hardware Designer | Hardware Design/Hardware Testing/Fixture |
Parts List & Cost
| Part | Quantity | Purchased From | Cost |
|---|---|---|---|
| ARM7 NXP LPC2148 Microcontroller | 1 | www.sjvalley.com | $59.99 |
| TLC 5940 – PWM Driver | 1 | www.sparkfun.com | $10 ea |
| Acrylic Glass | 16 - 2 X 2 X ½, 16 - 2 x 2 x 1/8, 2 – 7 X 7 x 1/8, 2 – 7 X 3 x 1/8 | TAP Plastics | $55 |
| LM741 Operational Amplifier | 4 | N/A | Provided by Electrical Engineering Department |
| Resistors | 10- 2- 1K, 1- 1.1K, 1- 5.5K, 3-10K, 1- 15K, 1- 33K, 1- 100K | N/A | Provided by Electrical Engineering Department |
| Male-to-Male Audio Cable | 1 | HSC Electronic Supply | $1.99 |
| 3 1/2 in. female Audio Jack | 1 | HSC Electronic Supply | $.49 |
| Battery Pack | 2- 4 AA Battery Pack | N/A | N/A |
| LED’s | 16- Ultrabright white LED’s | HSC Electronic Supply | $1.29 ea. |
Design & Implementation
This section provides details for the overall design of the project and it's implementation.
- Band Pass Filter for Isolating low and high frequency audio signals.
- Level Shifter shifts signals from bipolar to unipolar for microprocessor Analog-to-Digital (ADC) input
- Using the output from the level shifter, the signal was read in using a ADC on the LPC2148 microcontroller. The ADC value was used to determine the LED output values to display the bass response in the light fixture. The LEDs were driven by the TLC5940, a 16 channel PWM driver with a serial interface, for independent control of each of the 16 LEDs. Each channel is configurable for 12-bit intensity control and offers dot correction to normalize LED brightness. Only a basic pattern was implemented, however the variable intensity control allows for more complex patterns using the PWM width variable.
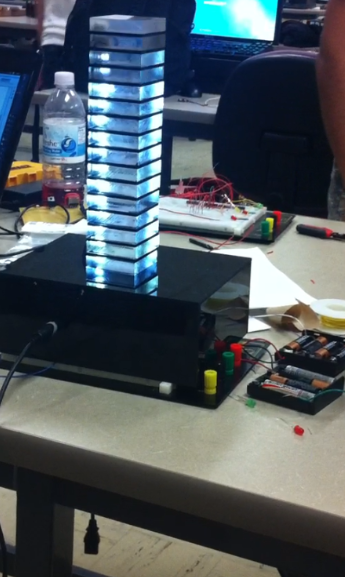
The figure shown below shows the Sound Meter.
Hardware Design
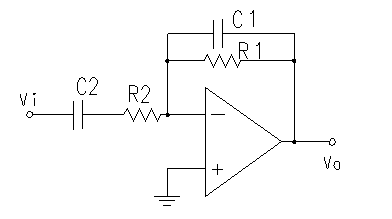
The hardware was implemented by combining several components together: band pass filter, level shifter and TLC5940 PWM driver. The band pass filter isolates low bass response frequencies and high bass response frequencies, the cut off frequency can be specified and calculated by using a set of Resistors. The level shifter conditions signal for input to the ADC on the microcontroller, and the TLC5940 was used to control the LED output.
Band Pass Filter Design
The band pass filter will filter out both low and high unwanted frequencies giving an output signal between Frequency low to Frequency high ex. (Fl < X < Fh) this project uses 90Hz as the center of frequency, this is calculated by (Frequency low + Frequency high)/2. Frequency high and low are calculated by 1/(2piRC). The low and high frequencies were calculated to be 45Hz and 135Hz, giving a center of frequency of 90Hz = ( 45Hz + 135Hz) /2. The OpAmp used in this project is the LM741 which V- and V+ can vary between -5V to -15V and 5v to 15V for easier use. R2= 5.5K ohms C1 = 1uF R1= 1.1K ohms C2 = 1uF op Amp = LM741
Level Shifter
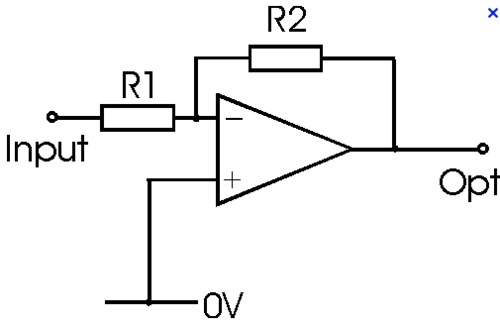
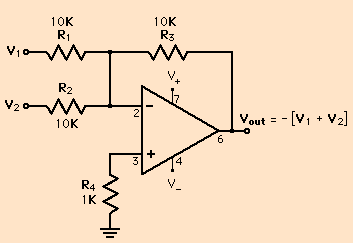
The level shifter will shift signal from bipolar to unipolar. Assuming the analog signal has a maximum amplitude Peak-to-Peak of 10V a range from -5v to 5V (these values change depending on the device) will be shifted to a range from 0V to 3.3V due to the micro controller characteristics. This process can be done in two steps first it will reduce the PP amplitude having a gain of less than 1 as ⅓ or less to bring down the amplitude PP from 10v to 3.3V(-1.65V to 1.65V). This is done by having a inverting amplifier Vout = -(R2/R1)Vin. The next step is to shift the signal to get positive voltage only. The level shifter is implemented by using a summing amplifier circuit Vout = -[Vin + Vadd]. The sinusoidal axis is at 0v and needs to be shifted up to 3.3/2 = 1.65 therefore a -1.65V Vadd is required.
- Inverting Amplifier Properties
- R1 = 33K ohms
- R2 = 100K ohms
- OpAmp = LM741
- Level Shifter Properties:
- R1 = 10k ohms
- R2 = 10k ohms
- R3 = 10k ohms
- R4 = 1k ohms
- OpAmp = LM741
TLC5940
The TLC5940 is a PWM driver specifically for supporting LEDs, although it supports motor control applications as well. Each of the 16 channels are controlled by a 12-bit grayscale and 8-bit dot correction register value. The 12-bit grayscale value adjusts between the 4096 LED intensities. The 8-bit dot correction is used to offset the intensity between each LED to normalize the brightness.
Light Fixture
The Light Fixture was structured using acrylic glass, acrylic glue, and ultra-bright light emitting diodes (LED's). The tower used 16- 2 X 2 X 1/2 in. acrylic squares stacked on top of one another. Between each plate a 2 X 2 X 1/8 in. black acrylic square was inserted in between in order to separate the light from each level of the sound meter. Each plate that contained an ultra-bright light emitting diodes had a whole made in the back in order to insert the LED. The wiring was handled along the back of the fixture and into our base with consisted of a 7 X 7 X 3 in. black box where all the hardware was stored.
Hardware Interface
The analog signal comes from any sound/music device as an mp3 player to the board by a jack to jack mono/stereo cable that goes connected to female jack mono adapter. From the adapter we will split the two signals, the ground to the common ground and the analog signal to the band pass to filter out the unwanted frequencies, having obtained the desired frequencies the PP amplitude will be reduced by the inverting amplifier circuit and finally shifted by the summing amplifier to have a digital signal from 0v to 3.3V.
TLC5940 Interface
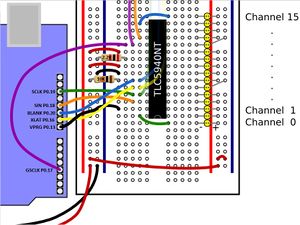
The PWM driver required several properly timed signals to clock in data along with a secondary clock for the PWM timer counter. The TLC5940 was interfaced to the microcontroller using a ‘bit banging’ technique, where each signal connected to the device was changed in software.
The SPI interface offers a very direct and easy approach for sending data over a serial interface, however the implementation required additional clock pulses during specific scenarios.The bit banging approach simplified the communication between the microcontroller and the PWM driver because of obscurities of clock pulses when sending gray scale data after the dot correction data was clocked in.
| Pin | Signal | Function |
|---|---|---|
| P0.17 | GSCLK | PWM Timer Counter |
| P0.16 | XLAT | Register Latch |
| P0.18 | SIN | Serial Data Input |
| P0.19 | SCLK | Serial Clock |
| P0.20 | BLANK | Enable LED Output |
| P0.13 | VPRG | Register Select |
The TLC5940 driver supported several functions, initialization of hardware, set channel intensity, write dot correction data, and write gray scale data. The TLC5940 was implemented using the bit-banging approach for the write functions. No read functions were used. The set channel intensity function updated a local data array with the grayscale data.
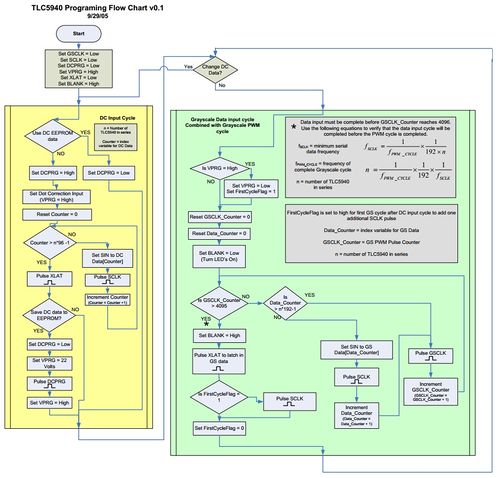
The initialization of the hardware was very straight forward. Each pin connected to the TLC5940 was a GPIO output. The output values were preset during initialization. From the flowchart below, the process was directly implemented using the diagram. Only the dot correction and grayscale write processes were supported. The TLC5940 also supported EEPROM programming to store dot correction data, however a 20v signal was required and therefore also left out.
To implement the bit banging loop, each signal connected to the TLC5940 was configured for GPIO. A 10K pull-up resistor was used on the BLANK signal in conjunction with the TLC5940 to prevent the LEDs from powering on during a microcontroller power cycle. For each signal change in the flow chart there is an equivalent interpretation in code.
To write the grayscale data, two counters are used, data counter and a GSCLK counter. While writing each bit of data, each clock must be pulsed and the correlating counter is incremented. The data counter must reach 192 before the GSCLK counter is 4096 to properly clock in all of the channel data. In the special circumstance dot correction data was clocked in before the grayscale data, an extra SCLK pulse must occur for the transition to complete. Unfortunately, the SCLK in the SPI hardware does not directly support manual pulses and would make the implementation more difficult.
While the TLC5940 interface was implemented inefficiently, other hardware peripherals could be enabled to improve the efficiency. Using a PWM and a timer would reduce the CPU time while sending data. However, given the nature of the project, the CPU was not being used for many other tasks and therefore was a simpler solution to implement.
Analog to Digital Converter
The LPC2148 directly supported multiple analog-to-digital converters for reading analog input signals. A driver was implemented to support simple functions to initialize the microcontroller pins, and sample the data in a timed interval. To time the interval of the ADC sample update, a hardware timer interrupt was implemented for fine precision timing.The driver was divided into three parts, initialization, get sample, and a timer interrupt.
The initialization of the ADC included initializing the hardware Timer1 for the ADC update. Timer0 was not used because it interfered with FreeRTOS. The initialization was done by configuring internal microprocessor registers for each of the related values. The ADC was initialized to support the full 10-bit sample on ADC1.0 connected to pin p0.6. The Timer1 interrupt queried the ADC1.0 buffer and updated a local class variable, adcSample every 500us. The timing was calculated based on the up frequency limit using the Nyquist theorem. The upper frequency limit used was 100Hz.
The get sample function returned the local adcSample value and did not read directly from the ADC.
Software Design
The software was implemented in a single task. The task initialized the ADC and TLC pins on the controller, and wrote dot correction data to the TLC. After the hardware was initialized, the task continuously computed pattern values for LED intensities and updated the TLC5940 with the most recent data. On each iteration of the loop, the task would sample from the ADC, generate the updated the grayscale data for each channel, and write the data to the TLC5940. In the ADC driver, the interrupt would fire based on a preset time and update the most recent sample. This would allow the updates to occur independently from the TLC5940 clock cycles.
Implementation
The entire implementation took place between a single task, a single input, and many GPIO outputs. The signal from the op amp circuit was sampled, then the pattern was computed. After the grayscale data was computed, the TLC5940 would be updated using GPIO bit banging and the LEDs would display accordingly.
Testing & Technical Challenges
Each component of the Sound Meter were designed and tested individually before assembly. Below are the steps taken to ensure the components would function correctly when connected.
TLC5940
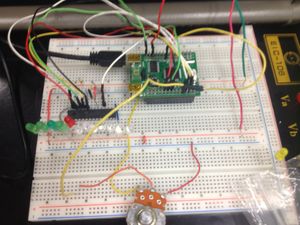
The TLC5940 took quite a bit of time to properly function with the driver. Numerous different methods were attempted with SPI and PWM before settling with the basic bit banging approach. In the future it would benefit the developer to start with a simple approach a point of reference and improve on the methods instead of working backwards. To test the TLC5940, the chip was setup on a breadboard with LEDs connected. The variable input for the ADC was from a potentiometer, which can be seen in the image, giving a total input range of 0-3.3v. The basic pattern and sample rate was adjusted until the performance was stable.
After connecting the TLC5940 to the op amp circuit, additional conditioning was required because the input signal did not span the complete range, 0-3.3v. Adjustments to the sample rate were also adjusted. Originally the sample rate was too high and caused, the LEDs would flicker.
Op Amp Circuits
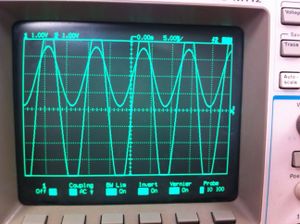
The testing was performed using a signal generator and an oscilloscope. The signal generator was used to generate a specific bipolar sine wave frequency with 10 VPP. The oscilloscope was setup to observe the input and output. In the figure, the oscilloscope output shows the signal 10v Peak-to-Peak at 60 Hz input and the output after going through both the Band Pass and Level Shifter Operational Amplifier. As the frequency was increased, the output amplitude was slowly dampened until practically nonexistent at around 1k Hz.
The operational amplifiers took a few weeks to assemble and test. Before implementing the operational amplifier circuit, the implementation was simulated using Simulation Program with Integrated Circuit Emphasis (SPICE). Even though the design functioned correctly on the simulation program when put onto the breadboard there was a different outcome. Due to noise and all other factors which are not ideal as in the simulation caused change to our expected result. When testing the circuits, we tested our circuits with a 10V Peak-to-Peak (PP) sinusoidal wave. Finally, when testing with other devices sending audio signal we noticed that our amplitude was really small and this was due to the fact we assumed all devices were going to output 10v PP sinusoidal wave. This problem was fixed by adding a gain operational amplifier. In the end the project functioned correctly with a few minor flaws. We could see the sound meter responding to the songs frequencies. At first it was hard to see the different levels lighting up. A timing delay helped out partly. The other factors could be all the noise and the different PP voltages output by the device.
Assembling the Components
After assembling the components and moving them to a battery solution, additional issues came up. The final implementation of the sound meter caused an inconsistent ground between the operational amplifier circuit and the ADC sample. The microcontroller was pulling power across the USB, while the opamp circuit was being powered by the batteries. The floating ground caused the ADC samples to be very erratic and inconsistent and caused the sampling to fail at last moment. An attempt to connect the common from the battery supply to the microcontroller caused a voltage spike and almost damaged the electronics. The microcontroller needed to be powered by the same battery pack to alleviate the issue. However, the last minute time constraints caused the ADC to fail during demo. If the hardware was implemented on a wire wrap board before our testing, last minute issues would have been less likely to occur.
Conclusion
In conclusion, the objective of the project was to make a sound meter. All of the tasks required were accomplished, and in the end we had a product that had great potential. During the process, we extended the project by making various different patterns and adding more LED's then what we first had in mind. However, given the time limitations, only the basic pattern was implemented.
While working on this project, the team came across many challenges. Each component had technical challenges to overcome, and scheduling the workload over the course of weeks was much more difficult than expected. Juggling tasks between other classes and Cmpe 146 became even more difficult toward the end of the semester. Most of the time was spent collecting parts and testing, while the design of the project went quickly. In the end, the sound meter did not function as intended due to grounding noise issues between the op amp circuit and ADC, which crippled out demo. However, with some minor tweaks the implementation has excellent potential for additional patterns and better performance.
References
Acknowledgement
- Preet Kang
- Lynn Jewel Omictin
- Allen Mamaril
References Used
- LPC 2148 Datasheet
- TLC5940 Datasheet
- LM741 Datasheet
- http://www.daycounter.com/Circuits/OpAmp-Level-Shifter/OpAmp-Level-Shifter.phtml
- http://www.allaboutcircuits.com/vol_2/chpt_8/4.html
- http://www.electronics-tutorials.ws/filter/filter_4.html
Appendix
Sound Meter Eclipse Project Files File:Cmpe146 S12 T6 soundmetercode.zip
