S14: Smart Weather Clock
Contents
- 1 Grading Criteria
- 2 Project Title
- 3 Abstract
- 4 Objectives & Introduction
- 5 Schedule
- 6 Parts List & Cost
- 7 Design & Implementation
- 8 Electric Imp Bringup
- 9 Electric IMP use for our project
- 10 2. Graphics LCD
- 11 3. DHT-22 - Temperature and Humidity Sensor
- 12 4. Nordic Wireless Server-Client
- 13 Testing
- 14 Conclusion
- 15 Acknowledgement
- 16 References
Grading Criteria
- How well is Software & Hardware Design described?
- How well can this report be used to reproduce this project?
- Code Quality
- Overall Report Quality:
- Software Block Diagrams
- Hardware Block Diagrams
- Schematic Quality
- Quality of technical challenges and solutions adopted.
Project Title
Abstract
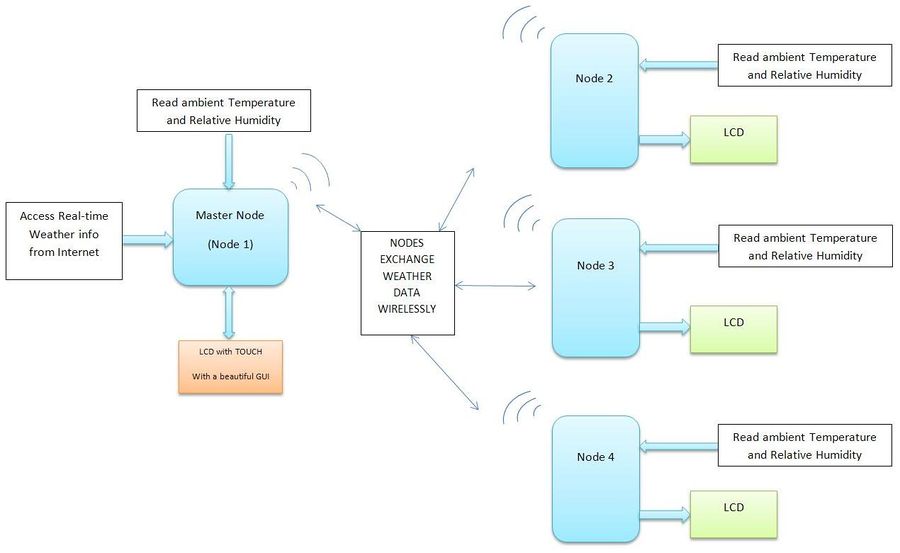
We plan to make four nodes of Weather Clocks that can communicate with each other as well as access the real-time weather from the Internet. The clocks also measure the indoor Temperature and the Humidity. All this information is displayed on a user-interactive graphic LCD with touchscreen. Each node can access the information of every other node as requested by the user.
Objectives & Introduction
- The main objective is developing a custom wireless protocol using the Nordic Wireless Mesh Network that can be used for communication of the four nodes.
- We also plan to access the real time weather information from the internet. The user can input the location of the city, and our clock will fetch the data from the internet and display it. To implement this, we have decided to use the "Electric IMP". We are giving our clocks the IoT (Internet Of Things) functionality so we can access our clocks virtually from anywhere.
- To make the clocks interactive, we would be using a Graphic LCD with touchscreen(uLCD-32PTU from 4D systems) and design a beautiful GUI. The user can select what information he wishes to see by clicking the icons. The user can also access the information from the other three nodes. The LCD would be interfaced on UART.
- To measure the indoor temperature and humidity, we would be using the DHT-22 sensor which can measure both. It's a One-wire sensor which sends out the data in pulses when requested. Measuring the length or time period of these pulses tells us if the data is logic '1' or '0'.
- All weather information will be logged in the Flash memory and will also be displayed on the graphic LCD as a graph of the parameter v/s time when requested by the user.
Team Members & Responsibilities
- Dhaval Parikh
- (Hardware design, sensor and Graphic Touch Screen LCD interface)
- Akshar Ranka
- (Electric Imp and 16x2 LCD interface)
- Huzefa Siyamwala
- (Wireless Communication (Server) and software integration)
- Raashid Kheruwala
- (Wireless Communication (Client) and LCD Interface)
Schedule
| Sr. No | Start Date | Projected End Date | Actual End Date | Task | Status |
|---|---|---|---|---|---|
| 1 | 3/1 | 3/7 | 3/7 | Finalise Component listing and Order Placement | Order Placed |
| 2 | 3/8 | 3/15 | 3/18 | Study of nordic wireless, Graphics LCD, electric Imp | Components Received. Testing begins! |
| 3 | 3/16 | 3/21 | 4/17 | Unit Testing for Graphics LCD, Algorithm and interface of Temp and RH Sensor | Made basic GUI on graphic LCD. Can send and receive data from LCD. Facing problems with Sensor! Working on it. |
| 4 | 3/22 | 3/28 | 4/3 | Getting Data from internet using Electric Imp | Data successfully received from Electric Imp using Openweather.org API's. Real-time weather info now available! |
| 5 | 3/29 | 4/4 | 4/17 | Integrating peripherals with SJ-One, Establishing communication between 4 nodes | Delay in integrating peripherals as sensor not working as desired. Will be done soon. Protocol defined and wireless communication established successfully between 2 nodes. |
| 6 | 4/9 | 4/15 | 4/25 | First phase of Testing / Happy path Testing | Integrated graphic LCD with the Electric Imp. Now displaying real-timer weather on the graphic LCD. Now working on the GUI. Problem with sensor found. Running behind by a week. |
| 7 | 4/16 | 4/ 21 | 5/1 | Bugs Resolving | Issue with sensor resolved. Observed the data pattern on oscilloscope. Now working on reading data. Also working on communication between 4 nodes. |
| 8 | 4/22 | 4/30 | 5/12 | Integrating the modules. | Sensor working perfectly. Electric Imp can access weather info from different cities. Now working on Hardware design, integration of all modules and bugs resolving. Back on track! |
| 9 | 5/1 | 5/6 | 5/17 | Final Testing | Started integration of the code. Getting some issues synchronizing 4 nodes. Working on it. Peripherals working perfectly. Integration successful. |
| 10 | 5/7 | 5/15 | 5/20 | Final Testing (contd.) | Project Completed! Nodes synchronized. Peripherals working perfectly! Working on the wiki report now. |
| 11 | 5/22 | Judgement Day (Project Demo day) | Wiki report completed. Project working fine! Successfully completed the project. |
Parts List & Cost
| Qty | Description | Manufacturer | Part Number | Total Cost |
|---|---|---|---|---|
| 1 | Serial TFT LCD - 3.2" w/ Touch | 4D Systems | uLCD-32PTU-GFX | $84.00 |
| 1 | Electric Imp Breakout board | Electric Imp | BOB-11400 | $20.00 |
| 4 | Humidity and Temperature Sensor- RHT03 | Sparkfun | SEN-10167 | $44.00 |
| 1 | SJOne Board | SJSU | - | $320.00 |
| 1 | Electric Imp card | Electric Imp | - | $30.00 |
| Total Cost | $498.00 |
Design & Implementation
Hardware Design
Hardware Interface
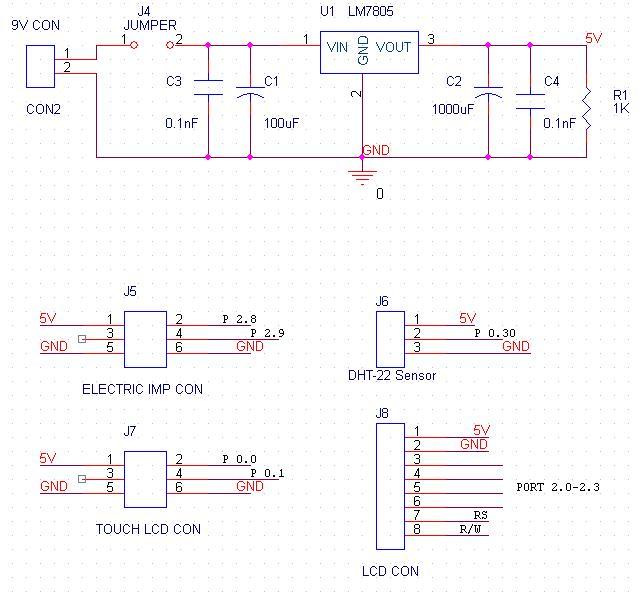
Our hardware module consists of following components:
1. Electric Imp
- Its a device that we are using in our project to connect to the internet. Electric imp is equipped with inbuilt SPI, I2C and UART ports. We are using UART port to communicate with the SJ-one board in this project. There are three UART configuration in the hardware that can be used in software, UART12, UART57 and UART1289. UART12 and UART57 are used for regular Rx and Tx communication. Pins 1 and 5 are used for transmission whereas pins 2 and 7 in the respective configurations are used for reception. UART1289 configuration is used for transmission and reception with flow control signals RTS and CTS.
- We have used UART57 mode for our project. Thus to interface and achieve communication between electric imp and SJ-one board, we have to connect Tx of imp with Rx of SJ-one and Rx of imp with Tx of SJ-one. By interfacing in this fashion, we make sure that data that is transferred by either imp or SJ-one will be received at the receiving end.
2. Graphics Touch Screen LCD
- A very versatile and easy to use LCD. Very simple to create beautiful user interactive GUI's.
- Interfaced to the Sj-One board via UART.
- Pins Tx and Rx of the Graphic LCD interfaced to the pins P0.1 (RxD3) and P0.0 (TxD3) of SJ-One board respectively.
3. Temperature and Humidity Sensor(DHT-22)
- One-wire Temperature and Humidity Sensor. Voltage range 3.3-5V. Although we found that the sensor doesn't work at 3.3V. Has very good range (upto 100 meters).
- Pin 1 : 5V
- Pin 2 : Data pin
- Pin 3 : NC
- Pin 4 : GND
- Data pin is open-collector pin. So external pull-up of 4K7 Ohm required. But the sensor has a pull-up resistor in-built. But be sure to check. Check the resistance between pins 1 and 2. If no resistance, connect an external pull-up.
- Gives Humidity value in terms of Relative Humidity (%rH) and the temperature as (degree Celsius).
Software Design
Server:
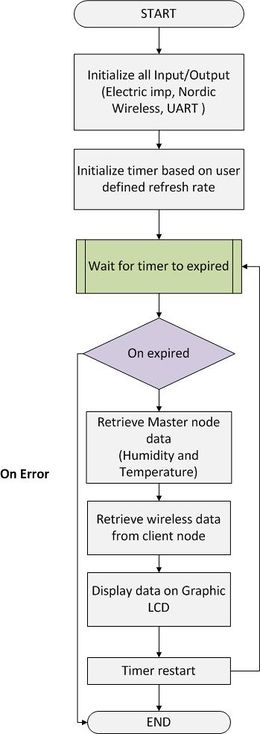
The main task of server is to provide communication link with all client nodes and periodically update itself with data from client node. It also need to refresh itself with real time data available from internet (openWeather API's) using electric imp.
Pseudo Code:
Server Code
    int32_t main(){
            /// initialize all input/output devices
            gLCD_Imp_init()
            while(1){
                  recieveDataFromClient();
                  updateDatatoLCD();
                  delay();
            }
     }
Initialize Graphics LCD(UART3) / Electric Imp(UART2) ports
     int32_t gLCD_Imp_init(){
               /// Power up
               LPC_SC->PCONP |= power_on_uartx;
               /// For enabling clock to UARTx
               LPC_SC->PCLKSEL1 &= ~(3 << 16);
               LPC_SC->PCLKSEL1 |= (1 << 16);
               /// Selecting UARTx TX/RX pin from Multiplexed port pins
               LPC_PINCON->PINSEL4 &= ~(0xF << 16);
               LPC_PINCON->PINSEL4 |= (0xA << 16);
               /// Enable DLAB for setting Baud Rate
               LPC_UARTx->LCR = enb_DLAB;
               LPC_UARTx->DLM = 1; //1;
               LPC_UARTx->DLL = (clock) / (16 * 9600);
               LPC_UARTx->LCR = 3;
               /// Enable fifo mode
               LPC_UARTx->FCR = ((1 << 0) | (1 << 6));
               /// Enable RDA interrupt
               LPC_UARTx->IER = 1;
               /// Hooking up Interrupt Handler
               NVIC_EnableIRQ(UARTx_IRQn);
     }
Receive data from Client Nodes
      int32_t receiveDataFromNodes(){
                Loop until response from all Nodes are received
                For node i,
                       wireless_send_packet(Client_Address,mesh_pkt_ack_app,FLAGS);
                       wait for response, until predefined time
                       if(wireless_get_ack_packet()){
                               wireless_deform_packet(buffer);
                               update sensor array data
                       }
                       iterate through other node
      }
Recieve live realtime data from internet
       typedef struct electric_imp_buffer{
             char city[16];
             char description[20];
             char temperature[10];
             char humidity[5];
             char datetime[20];
       }electric_imp_buffer;
       electric_imp_buffer buffer;

        int32_t UART3_IRQHandler(){
            /// We have configured Electric imp to send size of data
            /// as first two bytes of payload
            /// And each field of payload is separated by '#'
            char ch;
            if(counter<2){
               electic_imp_buffer=electric_imp_buffer<<8;
               electric_imp_buffer|= LPC_UART3->RBR;
            }else{
               while((ch=LPC_UART3->RBR)!='#'){
                   buffer.city[counter++]=LPC_UART3->RBR;
               }
               counter=0;
               while((ch=LPC_UART3->RBR)!='#'){
                   buffer.description[counter++]=LPC_UART3->RBR;
               }
               counter=0;
               while((ch=LPC_UART3->RBR)!='#'){
                   buffer.temperature[counter++]=LPC_UART3->RBR;
               }
               counter=0;
               while((ch=LPC_UART3->RBR)!='#'){
                   buffer.humidity[counter++]=LPC_UART3->RBR;
               }
               counter=0;
               while((ch=LPC_UART3->RBR)!='#'){
                   buffer.datetime[counter++]=LPC_UART3->RBR;
               }
            }
      }
Update data to LCD
      int32_t updateGLCD(){
               /// Writing commands to graphics LCD in specified format
               write_obj_to_display(WRITE_OBJ, GENIE_OBJ_METER, 0, 0,
                       (a[NO_OF_NODES - 1][1] / 10));
               write_obj_to_display(WRITE_OBJ, GENIE_OBJ_THERMOMETER, 0, 0,
                       (a[NO_OF_NODES - 1][0] / 10));
               write_obj_to_display(WRITE_OBJ, GENIE_OBJ_LED_DIGITS, 1, 0,
                       (a[NO_OF_NODES - 1][0] / 10));
               write_obj_to_display(WRITE_OBJ, GENIE_OBJ_LED_DIGITS, 2, 0,
                       (a[NO_OF_NODES - 1][1] / 10));
      }
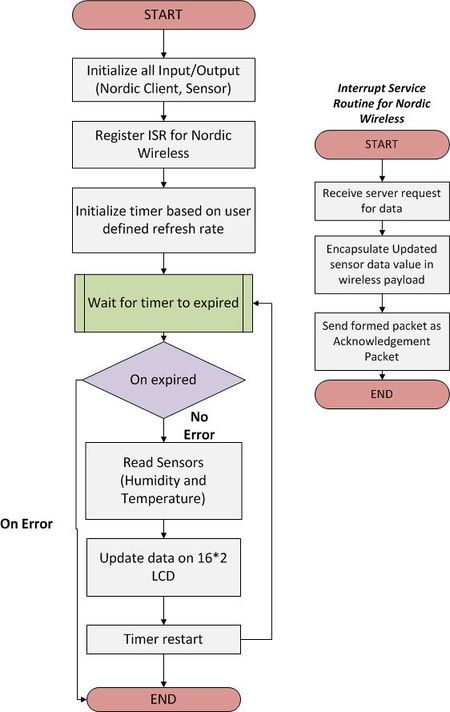
Client Node:
Pseudo Code:
Client Code
    int32_t main(){
            /// initialize all input/output devices
            Sensor_LCD_init();
            while(1){
                 writeDatatoLCD();
                 delay();
            }
     }
Setting Node Address
    int32_t setNodeAddress(uint32_t address){
           return (int32_t) mesh_set_node_address(address);
    }
ISR For Nordic Wireless receiving Server Request
    void NORDIC_UartHandler(){
        if (wireless_get_rx_pkt(&pkt, 100)) {
           /// Check if we were asked for an application ACK
           if (wireless_is_ack_required(&pkt)) {
                uint8_t tempOpcode=0;
                uint8_t humidityOpcode=1;
                wireless_form_pkt(&pkt, pkt.nwk.src, mesh_pkt_ack_rsp, 1,
                                      4,&tempOpcode,sizeof(tempOpcode),
                                      &temp_data,sizeof(temp_data),
                                      &humidityOpcode,sizeof(humidityOpcode),
                                      &rh_data,sizeof(rh_data);                                       );
            }
        }
         wireless_send_formed_pkt(&pkt);
    }
Implementation
1. Electric Imp
Electric Imp Bringup
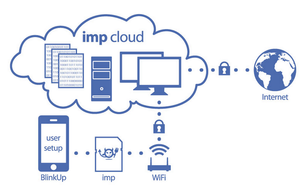
It’s an easy to use device using which we can connect our LPC micro-controller to the internet. By connect I mean we can fetch the data from web pages in real time. This data can then be used for processing such as controlling the sensors, motors, LED’s etc. So, using this data we can build and control systems without being present in the same area or any part of the world. Think of an air-conditioner, music player or entire home automation system which can be monitored and controlled from any part of the world via mobile phone or web browser. It has grown on the power of Internet of Things which has picked momentum in the recent time and combined the networking and embedded worlds.
The following steps are to be followed when you first start working with the Electric Imp:
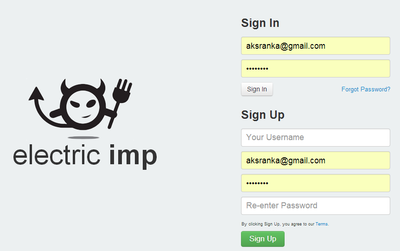
Step 1: Create an Electric Imp Account on www.electricimp.com
The first thing we need to do is create an Electric Imp account. Your Electric Imp account will be used to communicate with your imp, as well as provide access to the online Electric Imp development environment (IDE). No dedicated IDE on local machine is required for writing control programs for imp. The online IDE on imp website, its documentation about the API’s and knowledge of Squirrel scripting language are enough to use imp.
Step 2: BlinkUp Your Device
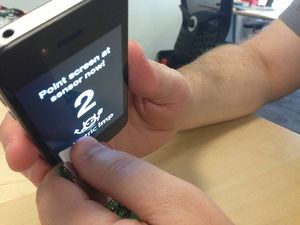
BlinkUp is the process used to transmit your wireless network's SSID (name) and encryption key (password) to your imp so that it can get online. BlinkUp transmits the information to the imp optically (by blinking the phone's screen). BlinkUp can be accomplished through Electric Imp's official iPhone or Android app.
Make sure the power jumper on your April board is populated, and set to USB
Let's make sure your imp is getting power:
1. Insert your imp into the SD slot.
2. Plug your USB mini cable into the imp, and your computer.
3. Your imp should begin blinking an internal orange LED.
4. Remove the imp from the SD socket (blinkup will only work during the first minute the imp has power - we're going to reinsert the imp right before we click BlinkUp in the mobile app).
Enter your credentials in the mobile app:
1. Open the mobile application on your iPhone or Android device.
2. Enter your account information and click login.
3. Select the wifi network you would like to connect your imp to.
4. If your wifi network has a password, enter the wifi password.
BlinkUp: 1. Reinsert the imp into the SD socket, and make sure the imp's internal LED is blinking.
2. Press the "Send BlinkUp" button in the mobile application.
3. Hold the screen of your phone flush against the end of the imp - Try to block out as much ambient light as possible. We recommend covering the exposed bit of the imp with a thumb while blinking up.
Your imp should now be online. It can now interact with the imp IDE hosted on www.electricimp.com website. If everything was successful the internal LED should be blinking green.
Step 3: Building out Circuit
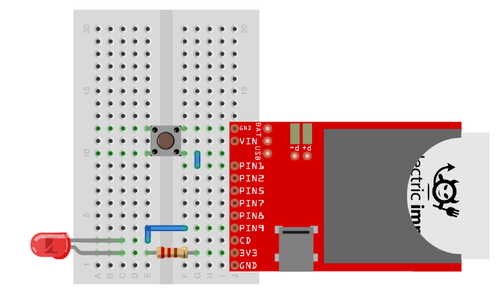
Let us take the example of blinking an LED by controlling it from the browser: Electric imp card consist of an ARM processor embedded into it. Thus, it is like any other fully functional controller with communication protocols such as UART, SPI, I2C present for onboard communication with other controllers. The impee also consists of a 12-bit ADC and fixed frequency DAC.
In this example a Led connected on pin9. This led will be set or reset by hitting a link in the browser. Every electric imp device has a dedicated agent link. This link is to be used to control any activity on the imp by using any parameter to set or reset in the browser query. The link looks as follows:
https://agent.electricimp.com/SRwUO3A-ty4c
Step 4: Getting our IDE setup
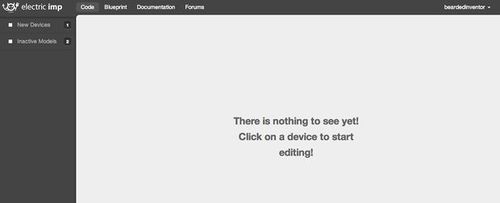
Once your imp is BlinkedUp it should be online and associated with your account. When you open Electric Imp's web based development environment (IDE) it should be listed under new devices.
To edit code for your new device: 1. Click on "New Devices" to view your un-configured device.
2. Hover over your new device, and click the gear icon next to it.
3. Enter a name for the device (the board the imp is plugged into).
4. Enter a name for the model (the block of code that will execute).
5. Click Save Changes.
At this point, you should see 3 windows:
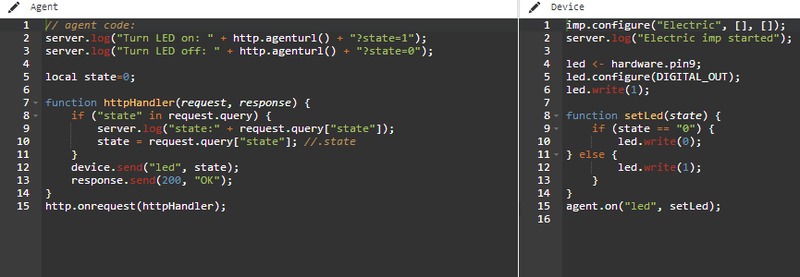
1.The Agent window is where you write code that you want to run in the Electric Imp cloud.
2. The Device window is where you write code that you want to run on the local device.
3. The Log window is where you can view system information (device on/off, connect/disconnect, as well as anything logged with server.log).
Step 5: Writing the Code
Code is written in agent as well as the device section to make the electric imp work. The agent gets the data from the internet by accessing different links that is specified in the agent code. The agent can access the data from the link itself. Suppose in the above LED blinking example we are required to control the led blinking using an android application consisting of two buttons, one for led on and off each. In the background we can design the app to access the agent link with state value padded at the end as follows, https://agent.electricimp.com/SRwUO3A-ty4c?state=0 For this link when state=0 is appended then LED may be turned off and vice versa with state=1.
This is just a help-get-start Project. By learning squirrel and reading the API documentation provided by electric imp programmers can use other exciting functions according to the need and relevance in their project.
Electric IMP use for our project
The idea to use electric imp was to get the data from the internet and achieve Internet of Things functionality. Since, it’s a weather application we need to get real time data from some servers online, so this was an apt device for our application. One of the major advantages of using electric imp was that it does not require any dedicated environment to be built on local machine. Just by making an online account on electric imp website, its IDE could be used over the cloud and all the codes are saved in runtime. Also, the entire code can be easily debugged by using server.log() function, using which all the variables can be easily printed and seen in the log area making it really simpler for the programmer.
The program starts with a query from the SJ-one board with a city name whose weather data is required. This query is received and reaches the device part of electric imp via the UART on breakout board. From the device the query now travels to agent which forms the link using the city name and gets the data from the web. This data now traverses back to device of imp to breakout to SJ-one which displays this data on a graphics LCD. The various functions and API calls that are used in the device agent code of our project are as follows:
1. Initialize getcitystr=””, cnt=0 and turn=0.
2. Configure the UART hardware of imp using “hardware.uart57.configure (38400,8, PARITY_NONE, 1, NO_CTSRTS,getdata)”. In this configuration 38400 is the baud rate, 8 is the data length in bits and getdata is the callback function.
3. Getdata() is use to read the data from the UART. This function is called every 10seconds using “imp.wakeup(10.0,getdata)” call. In this function we read the the data from UART using “hardwre.uart57.read()” if turn =0. Turn is used to maintain the atomicity of uart read or write function to avoid a read or write miss. When the entire cityname is read, it is sent to the agent code to get the data from internet using “agent.send(“city”,cityname)” function call.
4. As soon as the device sends the data, the agent receives it using device.on(“city”,agenturl) function. “.Send” functions can be used to send data from agent to device and vice versa. “.On” functions are always waiting on data from send function. In agent we update the global variable “agenturl” with the city name.
5. The most important function call in imp for our project is http.onrequest((function(request,response))
This function is only called when the agent link is accessed by some browser. Now, to use custom links that are different from the agent link (“http://api.openweathermap.org/data/2.5/weather?q="+agentUrl+"&mode=json” for our project) of impee, we used http.get(url+agenturl, { "Content-Type": "text/json" }) function. In this function the first parameter specifies the link that we want to execute added with the global variable “agenturl” in the agent code, which is used to change the city name as per user request while the second parameter is used to indicate that the type of data that we are going to read from the link is of type JSON. After the http.get function it is required to call request.sendsync() function without which the link would not be activated.
6. The above function is called on a response object. Now we can use JSON parsing functions “local data = http.jsondecode(response.body)” on this object to retrieve and separate the fields as required. The JSON data string from the openweathermap.org website which we are using in our project to fetch live weather data is as follows:
{"coord":{"lon":121.89,"lat":37.34},"sys":{"message":0.0367,"country": "United States of America","sunrise":1400763174,"sunset":1400814938},"weather":[{"id":802,"main":"Clouds","description":"scattered clouds","icon":"03d"}],"base":"cmc stations","main":{"temp":285.67,"humidity":85,"pressure":1013.3,"temp_min":285.15,"temp_max":286.15},"wind":{"speed":1.05,"deg":166.504},"clouds":{"all":32},"dt":1400764287,"id":5392171,"name":"San Jose","cod":200}
In the above string parameter before the “:” is main category of similar parameters. “{}” indicates an array of parameters while “[{}]” indicates an array of arrays. Let us see how we can fetch description of the weather and country name from the above string. local descriptn = data.weather[0].description; local cntry_name= data.sys.country;
7. Now parse the data that is required in the application and send it to the device using device.send() function. This data will then be received by the device using agent.on() function. Whenever ON function is called it calls a callback function. In this function we call the “hardware.uart57.write(data)” function if the turn is 0.
8. This data is then received by the breakout of the impee, which then finally transfers it to the SJ-one board. This data is now processed by the LPC board and send it over other UART to graphical LCD.
2. Graphics LCD
We have used the uLCD-32PTU from 4D Systems. It’s a graphic LCD with a resolution of 240x320 which is very simple to use. The LCD can be used for making quick GUI’s.
We need the IDE which is available on the website to program the LCD.
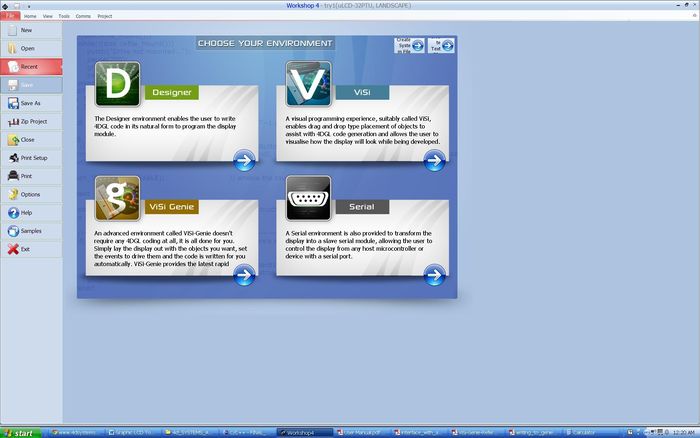
We can program the LCD using three methods:
1) ViSi Genie: This is a drag and drop mode. There are objects available in the menu which can be drag-dropped on the screen. These objects include switches, text boxes, gauges, thermometers, angular meters, etc. This mode doesn’t require any programming. Just like the name, it’s a genie. We use the object which we want and the IDE automatically generates the code required for it. We have used this mode for programming the LCD.
2) ViSi : This mode is a combination of the 4DGL programming language assisted with drag-drop of objects. Since we had a deadline to meet, we didn’t learn the 4DGL programming language. But this can be done if you have enough time.
3) Designer: This mode is pure 4DGL programming language. Each object needs to added using the programming language. The only benefit of using this code is we can make use of the peripherals and busses available on the Touchscreen. The uLCD-32PTU has on-board I2C and UART ports and also has buzzer and ADC. We can make use of these functionalities by using the 4DGL programming language. These peripherals can also be used in the ViSi mode. Once you’ve made up your mind with the environment you wish to use (mostly you would go with the ViSi Genie environment), we will show you how to use the IDE and the LCD from scratch. 4D systems has very well documented app notes which can be found on this link: http:/www.4dsystems.com.au/appnotes/ Refer the app notes in the ViSi-Genie category.
• First you need the uUSB-PA5 : microUSB Programming Adaptor OR the Programming Cable : USB to Serial UART Bridge Converter Cable. IMPORTANT NOTE: Without either of these you cannot program the LCD. VERY IMPORTANT NOTE: DO NOT USE THE STANDARD USB TO 232 CONVERTER! THIS WOULD INSTANTLY DAMAGE THE LCD. YOU NEED THE USB TO TTL CONVERTER AND NOT 232.
• Once you have interfaced the LCD using the USB to SERIAL cable now comes the fun part of making beautiful GUI on the LCD.
• After selecting the appropriate model of the LCD (uLCD-32PTU in our case) , select the ViSi – Genie environment.
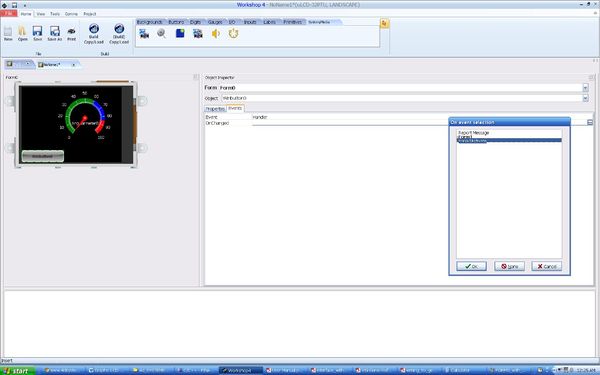
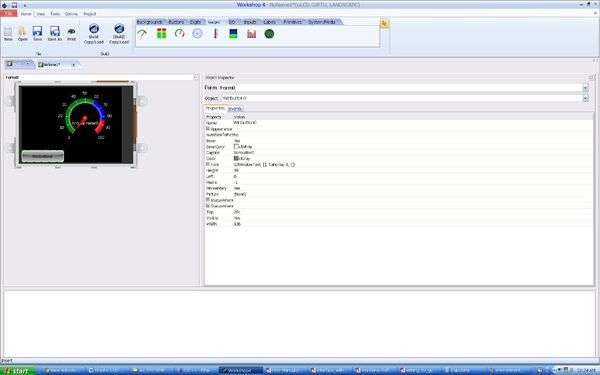
• You will see the screen on the left. This screen is for our reference and it gives us an idea how our GUI would look on the LCD without actually programming it.
• The way it works is that we can make FORMS on the LCD. Forms are like different pages which are used for displaying information or taking inputs from user.
• We will start with the first and default form. You can see the different tabs on the top in the IDE. These tabs contain objects such as buttons, angular meters, etc. We leave the exploration of the different objects on you.
• To start with select the “Fancy Button” under the buttons tab. Draw the button of your desired size anywhere on the screen. On the right side, you can see the “object inspector” of the button. You can change the name of the button (under “captions” field), the background and foreground color, the font size and style. It is very flexible.
• Important thing to note is the name which would “Winbutton0”, since it’s the first button. The ‘0’ here is the index which acts as a reference to address the button.
• Now add an “angular gauge” to the screen. Resize it, change the color, the digits size, color, the span of the arc, the range in the “object inspector” section. We leave the exploration on you. Note the name of the meter and more important the number at the end of the name – the index. (e.g. angularmeter0). We will give more light on the index field later on.
• Your first Form is now ready. Let’s add one more form from the “system/media” tab. This form is named as form1. Now we will link the button created on the first form to the Form1 such that by pressing the button, Form1 will be displayed.
• Goto the Form0. Select the button. In the object inspector, select the “Events” tab. Each press on the screen creates an event and we can configure the event whether to goto a new form when pressed or report a message to the host controller.
• On clicking on the handler, we can see the various options available. Select the “Form1 activate”. This means that the Form1 would be activated when the button is pressed. Your basic GUI is now complete! It’s simple isn’t it?
Steps to program the LCD:
• Once the LCD is properly interfaced (you need to cross the Rx and Tx lines), goto “COMMS” tab and select the proper COM port and you should see the name of the LCD on the top left corner of the IDE. There would be a green symbol which means the IDE has detected the LCD.
• Press the “Copy/Build” button. NOTE: You would need a microSD card. The IDE stores the user images on the microSD. Even though we are not using any images, we still need a microSD card. The microSD should be formatted in FAT file format only.
• Just follow the steps on the dialogues popped in the IDE and you should be just fine.
• After the process is finished, the LCD won’t show our GUI unless we insert the SD card. It would keep flashing an error message.
• After inserting the SD card, our GUI would be up and running! Voila! Press the button, you can goto the next screen.
Now we show you how to interface this LCD with a host processor (the SJ – One board in our case).
• Interfacing LCD with the processor is simple. We have used the UART port which was initially used for programming the LCD.
• Again you need to cross connect the Rx and Tx pins of SJ-One board and the LCD.
• But to send the data on the LCD and specifically to objects like thermometers and gauges, we need to follow the specific frame format for the LCD.
• Remember the index which we talked about previously? We need to use those index numbers to address the object.
• We would recommend you to go through the ViSi-Genie Reference manual available on the app notes section of the website to understand the frame format in detail. Here’s the link: http://www.4dsystems.com.au/downloads/Software/4D-Workshop4-IDE/Docs/ViSi-Genie/ViSi-Genie-Reference-Manual-REV1.pdf
• You can Write objects ( e.g. sending some data for the angular meter), or Write Strings or Read Objects.
• Just to give you a basic idea of the UART frame format required: We will give you an example on how to write objects (angular meter in our case).
1) Byte 1: CMD (0x01) which is the write object command.
2) Byte 2: OBJ-ID. This is the ID that tells the LCD that we are addressing the Angular meter and the Thermometer or anything else. The list of ID’s can be found on page 7 of the “Writing to Genie Objects from Arduino” file in the app notes section. Here’s the link of the PDF: http://www.4dsystems.com.au/downloads/Application-Notes/4D-AN-P4018_R_1_0.pdf . The ID for angular meter is 0x07.
3) Byte 3: OBJ-INDEX. This is the index number previously mentioned. The index is ‘0’ in our case. So this field would be 0x00.
4) Byte 4: The Most Significant Byte of the value to be sent.
5) Byte 5: The Least Significant Byte of the value to be sent. (e.g. to send a value 360 (0x168) to the meter, MSB : 0x01 and LSB : 0x68 )
6) Byte 6: CHECKSUM. The checksum byte is used for verification of the frame. Calculating the checksum is fairly simple. Just XOR (using the ^ operator) all the bytes from byte 1 to byte 5.
• So our UART frame would be: 0x01, 0x07, 0x00, 0x01, 0x68, 0x6F
• When we send this frame, the LCD will automatically move the needle of the meter to the value 360.
• Another thing to note is, that if the LCD receives the frame without any errors, it will send one byte of ACK (0x06) back to us. If there is data corruption or invalid frame format sent by us, it sends a NACK byte (0x15). This can be used as a trigger to resend the data to the LCD or give some warnings!
This covers the basics of making a GUI on the uLCD-32 PTU. Using this as a guide, we encourage you to try more stuff on your own.
3. DHT-22 - Temperature and Humidity Sensor
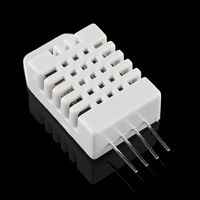
The DHT – 22 Sensor also known as the RHT03 sensor is a 1-wire temperature and humidity (relative humidity) sensor. The best part is that it requires only one pin from the GPIO port and it can used long transmission distances up to 100m.
There isn’t any good documentation on the internet for this sensor. The references available online is one datasheet from MaxDetect and the Arduino libraries. We will try to cover the sensor’s working in detail.
VERY IMPORTANT NOTE: Before we start, one thing to note is that although the operating voltage range of the sensor is mentioned as 3.3V – 5V on the datasheet we found that the sensor does NOT work at 3.3V. So we recommend you to use a 5V supply and have a common ground with SJ-ONE board’s ground.
The data pin of the sensor (Pin 2) is an open collector I/O pin, which means the pin can only pull itself low (0 V) and it cannot drive itself High (5V) . The documentation found on the internet says we need an external pull-up resistor of 4K7 Ohm connected to Vcc. However, if you measure the resistance between the Vcc pin (pin 1) and the data pin (pin 2) there is already a pull-up inside the sensor. Thus, you don’t need an external pull-up resistor. Although, it’s always advisable to check if there is a resistor inside. The 1-wire protocol is actually simple to understand but a little tricky to implement. The protocol works as follows:
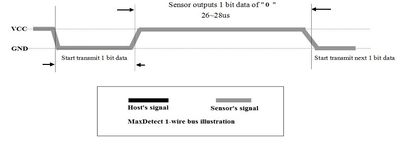
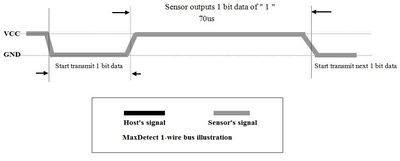
Unlike the usual sensors, the DHT-22 sensor being a 1-wire sensor sends out data only on a single pin. Instead of pulling low for sending a ‘0’ and pulling high for sending a ‘1’, the sensor sends out ‘pulses’ of different time periods for bits 1 and 0.
For sending a bit ‘0’, the sensor sends out a pulse of 28us ON time and for bit data ‘1’, it sends out a pulse of 70us ON time.So the tricky part is detecting the 1’s and 0’s on the line.
According to the protocol,
1) First, we need to configure the GPP pin of our SJ-ONE board as output. Then we need to send a ‘START’ pulse to sensor. This is sent by pulling low the line for a minimum time period of 1ms. Then the line should be pulled high for a time of 20-40us. On detecting this pattern, the sensor will automatically pull-low the data pin for 80us followed by pulling it high again for 80us. This is like an ACK signal.
2) After this, the sensor sends 40 bits of data one after the other continuously.
16 bits of RH data + 16 bits of Temperature data + 8 bits of checksum.
Checksum can verified by OR-ring the RH and temperature data 8 bits at a time.
(8bitsRH + 8BitsRH + 8bitsTemp + 8bitsTemp).
3) To detect the bits we can use a do-while() loop which keeps polling the data line periodically say every 2us and breaks if the time exceeds because of an error. Another option is to use hardware timer interrupt and external interrupt.
How we implemented the protocol: We start by configuring the data pin as output. The start signal is sent by using the delay_ms(). We make the pin low, then call the delay_ms(1). Next we configure the pin as external interrupt to detect the rising edge. Thus each time the sensor sends the pulse (each pulse has a rising edge), the external interrupt occurs. In the external interrupt ISR we start a hardware timer configured to produce interrupt every 70us. Inside the timer interrupt ISR, we check whether the pin is high or low. If the pin is still high, the data sent by sensor is data ‘1’ if pin is low that means the data sent is ‘0’.
On detection of the data bit, we left shift the data into a variable, reset and stop the timer, and clear the timer interrupt. You might have noticed that in sending the start signal we are NOT pulling high the data pin for 80us after pulling it low for 1ms. This is a quick fix, once we pull up the data line after 1ms, the sensor does everything else! It automatically sends the ACK signal followed by 40 bits of data i.e. the sensor pulls down and pulls up the data pin on its own, and our external interrupt and Timer ISR does the rest.
One Critical Point to take care of: If you are trying to interface the sensor without the hardware timers and external interrupt. You can do that by referring the Arduino libraries. But, the point to take care of is it is hard to debug the logic when you use do_while() loops and delay_us() functions. You might use printf() to see your program flow, but this would actually make your logic to NOT work. Since the sensor sends precisely timed pulses, using printf() would introduce even more delays in your code and you won’t be able to read actual data.
It is extremely important that you follow state diagram as specified otherwise there are very high chances of corrupted data being delivered by Sensor. If any error is detected in state transition, it is always recommended to send start signal after delay to restart the calculation process again.
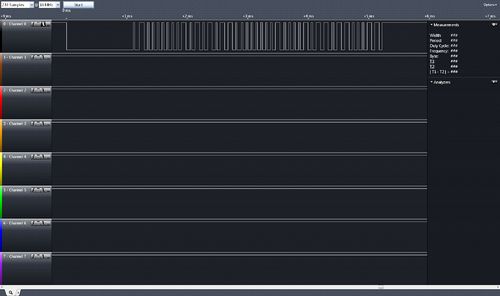
One possible solution: Use on-board led’s. Turn ON led’s instead of using printfs. This will not waste time. For your reference, you can see the data pattern from the sensor. It is captured using a Logic Analyzer.
4. Nordic Wireless Server-Client
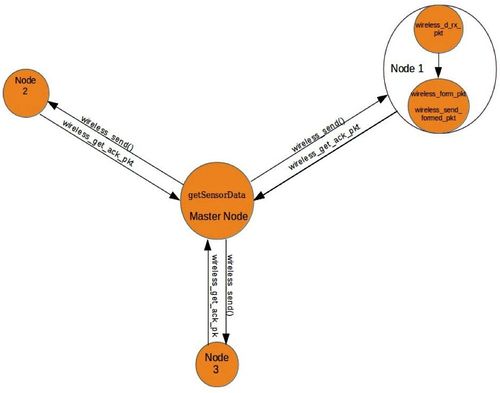
function getSensorData(void) at the server side ie Master node will get data from three nodes or client one by one. It would start from first client according to the address given by 50, 51, 52. Here the auto acknowledgement is not performed and hence for the destination to send us back the acknowledgement the function mesh_pkt_ack_app is used.
There are three nodes to get data from in our case and hence one by one we ask for data from all the three clients. We have employed the condition wherein it checks which node we are asking the data from. The wireless_send() function sends the data packet and it returns true if the sending is accomplished successfully and if it returns false then there was a failure in sending the packet. Let us assume that the master sends the data packet to the slave successfully then upon receiving the acknowledgement of the data packet it waits for the slave to return back the packet successfully duly containing the temperature and humidity sensor data. Upon reception it prints the reception message and further the server or the master goes on to print or display the data packet in entirety according to the TCP/IP standard protocol.
The next step is to deform the packet the same way as it was formed. After deforming the packet, temperature data and the humidity data is given to the output.
Here are some of the Nordic wireless API we used for our project.
wireless_send(addr[noOfNodes], mesh_pkt_ack_app, &cmd, 1,hops))
The function sends the data packet to the particular node which is identified by the addr[noOfNodes] parameter. Upon receiving the data packet the node sends the acknowledgement back to the sending node which is stored in mesh_pkt_ack_app. The parameter hops give the distance between the two nodes.
wireless_get_ack_pkt(&pkt, 1000)
If the acknowledgement comes then the function returns true if not then it returns false.
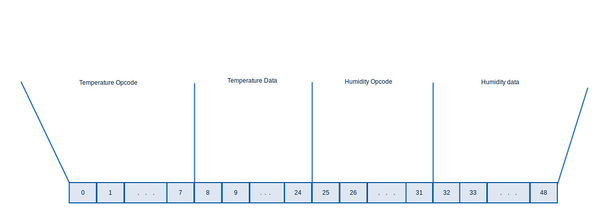
 wireless_deform_pkt(&pkt, 4, &tempOpcode, sizeof(tempOpcode),
                       &tempData, sizeof(tempData), &humidityOpcode,
                       sizeof(humidityOpcode), &humidityData,
                       sizeof(humidityData))
This function deforms the packet in a way which it was formed. The temperature opcode and data and the humidity opcode and the data can be got from this function.
 wireless_form_pkt(&pkt, pkt.nwk.src, mesh_pkt_ack_rsp, 1,
                                      4,&tempOpcode,sizeof(tempOpcode),
                                      &temp_data,sizeof(temp_data),
                                      &humidityOpcode,sizeof(humidityOpcode),
                                      &rh_data,sizeof(rh_data)
                                      )
This function is responible for forming the packet wherein the address of the packet, size of temperature and humidity opcode are parameters of the function.
wireless_send_formed_pkt(&pkt);
This function is responsible for sending the formed packet to all three slave nodes.
wireless_is_ack_required(&pkt)
If the server has asked for the client for acknowledgement then this function would check for the same towards client side.
wireless_get_rx_pkt(&pkt,100)
The function at the client side will wait for the request from the the server master node.
Testing
| Sl. No | Test Case | Test Description | Result Expected | Status |
|---|---|---|---|---|
| 1 | Sensor Testing | Supply voltage +5V and send a start pulse | Sensor should respond with 40 bits of data. Checksum compromised of 1 byte is appended at the end and need to be same as calculated checksum | PASSED |
| 2 | Sensor Testing :Verifying checksum | Supply voltage +5V and send a start pulse | Sensor should respond with 40 bits of data which can be observed on Oscilloscope or Logical Analyzer | PASSED |
| 3 | Graphic LCD Simple Angular meter | Sending test increment value via UART to LCD | Angular Meter should display incremented value. LCD should respond with acknowledgement byte 0x00 ox06 | PASSED |
| 4 | Graphic LCD Creating and Linking Forms | Need to configure the event generated on the button press | If button is pressed, a new form should get displayed on the screen | PASSED |
| 5 | Nordic Wireless: Ping Request | Each configured node should be reachable and can be determined through ping request | Send Ping message type to the configured and client node getting ping request should just respond back which can viewed. Server should receive response and display on Hercules that Node is reachable | PASSED |
| 6 | Nordic Wireless: Acknowledgement Response | Each configured node should be reachable and can be determined through ping request | Send Ping message type to the configured and client node getting ping request should just respond back which can viewed. Server should receive response and display on Hercules that Node is reachable | PASSED |
| 7 | Electric Imp: Communication between Agent and Device | A variable need to send using device.send(...) function call | Agent.on is waiting for any date sent from the device. This data can be verified using server.log(...) | PASSED |
| 8 | Electric Imp: Controlling LED using Web browser | Configure pin <1..9> on breakout board to control the status of LED | As soon as the agent is clicked, httpHandler function kicks in and checks for the status of "state" parameter appended with the link using request.query(...) function. Depending on the state value, if state==0 LED will turn OFF and vice versa | PASSED |
| 9 | Electric Imp: Getting data from internet using SJ-One | Query a data from SJ-One to a "Facebook" api online and receive that data back to SJ-One | Received data is displayed on Serial terminal like Hercules and needs to be verified using server.log(...) | PASSED |
Challenges faced
1) No communication between LCD and Computer and between SJ-ONE board and LCD. Solution:
· Check the Baud Rate. It should be 9600. The LCD supports only 9600.
· Check the Rx and Tx connections. They should be cross connected. Try interchanging them.
· Check your UART program whether the GPIO pins have been selected as RxD and TxD. Check whether you have powered on the UART (the PCONP register).
2) LCD blinking an error message and not showing the GUI.
Solution:
· Check whether the IDE has copied the project files in the microSD card. Generally it copies 3 files.
· Silly thing, but check whether the microSD is inserted behind the LCD.
· And one last thing, check if the microSD card is formatted in FAT file system.
· We had first used a SD card which wasn’t supported by the LCD, so we changed the SD card and used of some other manufacturer and it worked perfectly.
3) You are sending the data to the LCD. But it won’t display it.
Solution: · Strong possibility that there is an error in the frame format. Check the Object ID, and print the checksum on the serial terminal. Use a fixed byte of data for testing for which you calculated the checksum. Verify your answer with the printed checksum.
· Also check the response of the LCD. Is it sending a NACK byte? Then definitely there’s a problem with the frame format or your checksum.
· And one more thing, double check your connections.
4) For electric imp, JSON data is not updated regularly
Solution: Since every time, a new request is made by master node, updated weather data needs to be received back. For this, we used reponse.body().
5) For electric imp, UART trying to read and write at the same time
Solution:This is a common synchronization problem and we used turn variable mechanism to avoid synchronization problem and simultaneously avoid read and write problem at the same time.
Issues interfacing the Sensor (DHT-22)
These were the issues encountered while interfacing the sensor and the possible solutions:
1) No output from sensor.
Solution:
· Make sure the sensor is getting proper voltage at pin 1 and that pin 4 is properly grounded.
· As mentioned previously, the sensor doesn’t seem to work at 3.3 V. Connect a 5V supply instead.
· Check the resistance between pins 1 and 2. Should be around 4K7 Ohm. If no resistance, use a pull-up resistor externally.
· Finally, if you still don’t get any output, use a Digital oscilloscope or a Logic Analyzer to probe into the sensor. We highly recommend you to use Digital oscilloscope or a Logic analyzer. This will help you analyze the data sent from the sensor. Check whether the sensor is sending data. If it doesn’t probably the sensor is not working.
· One quick fix check – If you have an Arduino board, interface the sensor directly to it. Use the Arduino DHT-22 libraries to check whether the sensor is working.
· Still not working? Use another sensor.
2) Ok so I’m getting some data from the sensor. But, the data doesn’t make sense. Getting very huge values for RH and temperature?
Solution:
· Good job getting the data from the sensor. You are half way there. If you are using our approach to get data from the sensor, you would be getting more than 40 bits of data. Why? Because we configure the GPP pin as external interrupt, the rising edge of the ACK signal sent by the sensor is also in the received data.
· Best method is print the entire data received from the sensor once it’s received. Analyze the bits. Extract the first 16 bits, convert it to decimal (RH data). Take next 16 bits, convert to decimal (Temperature data). The next 8 bits are the checksum. It’s likely that the decimal values would be very high. In the range of 1000’s. That’s not right. Now, discard the first bit, repeat the same procedure. You will probably figure out form where to start. Note: The temperature is sent by the sensor in Celsius and not Fahrenheit.
· This was how we figured out the right data. It’s a little lengthy method though. But sure to work. Discuss the issue and resolution.
Conclusion
We have successfully implemented the smart weather clock interfacing four nodes via Nordic wireless modules and learning important concepts about Electric imp which is used to access the real time weather data from the internet. This was our first attempt to learnt IOT. Further the project enhanced our practical knowledge regarding touch screen usage. The other thing we learn is how to collaborate our cross functional team and complete the job on committed data without compromising on quality.
Project Video
https://www.youtube.com/watch?v=ynY7jx99fwQ
Project Source Code
Send me your zipped source code and I will upload this to SourceForge and link it for you.
Acknowledgement
This project would never have been possible without guidance and advice from Prof. Preetpal Kang. His class was really excited and RTOS material which he covered in the course really helped us to break the barrier and come up with this innovative project completion. Also, our thanks goes to openweathermap.org for providing free weather API's to be used for collecting live real time weather data. And last but not the least, we would like to thank sparkfun.com for providing all the components delivery on time.
References
[1] http://www.4dsystems.com.au/appnotes/
[2] http://www.avrfreaks.net/index.php?name=PNphpBB2&file=printview&t=122871&start=0
[3] https://mbed.org/cookbook/RHT03
[4] https://ide.electricimp.com/ide/
[5] http://forums.electricimp.com/
[6] http://openweathermap.org/API
[7] https://www.youtube.com/watch?v=_BuqBhlk4Ig
Relevant Datasheets and App notes are uploaded at the Source Forge link.
