S16: Number 1
Contents
Grading Criteria
- How well is Software & Hardware Design described?
- How well can this report be used to reproduce this project?
- Code Quality
- Overall Report Quality:
- Software Block Diagrams
- Hardware Block Diagrams
- Schematic Quality
- Quality of technical challenges and solutions adopted.
Project Title
Abstract
This section should be a couple lines to describe what your project does.
Objectives & Introduction
Show list of your objectives. This section includes the high level details of your project. You can write about the various sensors or peripherals you used to get your project completed.
Team Members & Responsibilities
- YuYu Chen
- OpenCV Programmer
- Kenneth Chiu
- Programmer/Video supplier
- Thinh Lu
- OpenCV Programmer
- Phillip Tran
- OpenCV Programmer
Schedule
Show a simple table or figures that show your scheduled as planned before you started working on the project. Then in another table column, write down the actual schedule so that readers can see the planned vs. actual goals. The point of the schedule is for readers to assess how to pace themselves if they are doing a similar project.
| Week# | Date | Task | Status | Completion Date | Description |
|---|---|---|---|---|---|
| 1 | 3/21/2016 | Get individual Raspberry Pi 2 for prototyping & research OpenCV on microcontroller | Completed | 3/20/2016 | |
| 2 | 3/27/2016 | Continue Research and learning OpenCV. Familiarize ourselves with API. Know the terminologies. | Complete | 4/2/2016 | |
| 3 | 4/2/2016 | Complete various tutorials to get a better feel for OpenCV. Discuss various techniques to be used. | Complete | 4/2/2016 | |
| 4 | 4/4/2016 | Research on lane detection algorithms. IE. Hough Lines, Canny Edge Detection, etc. Start writing small elements of each algorithm. | Complete | 4/8/2016 | |
| 5 | 4/14/2016 | Run sample codes on a still, non-moving picture. | Complete | 4/8/2016 | |
| 6 | 4/20/2016 | Write our own algorithm, and test it. Camera input, Proper Hough Line generation. | Complete | Included blurring, edge detection, and Hough transform. This is the base for the lane detection.
Problem 1: A lot of noise being picked up by Hough transform. Status 1: Binarizing image seems to help decrease a lot of the noise. Gets rid of a lot of unnecessary objects Problem 2: Gaps in lanes do not complete Hough transform. Status 2: Currently working on Hough transform filters and Custom Region of Interest. Will possibly use birds-eye view. | |
| 7 | 4/22/2016 | Modify the code for our own project objective. Include a "lane collider" to see when we cross a lane. | Complete | ||
| 8 | 5/2/2016 | Implement the code with Raspberry Pi 2 | Complete | ||
| 9 | 5/8/2016 | Testing in Lab and attach feedback system | Complete | ||
| 10 | 5/14/2016 | Testing on the road | Incomplete |
Parts List & Cost
Raspberry Pi 2 - Given by Preet
Raspberry Pi camera - $20
Design & Implementation
The design section can go over your hardware and software design. Organize this section using sub-sections that go over your design and implementation.
Hardware Design
Discuss your hardware design here. Show detailed schematics, and the interface here.
Hardware Interface
In this section, you can describe how your hardware communicates, such as which BUSes used. You can discuss your driver implementation here, such that the Software Design section is isolated to talk about high level workings rather than inner working of your project.
Software Design
Below shows the basic algorithm on how lane detection can be achieved. The problem is that this will still produce a lot of noise, and intermediary steps must be done for proper lane detection.
(IN PROGRESS)
Implementation
This section includes implementation, but again, not the details, just the high level. For example, you can list the steps it takes to communicate over a sensor, or the steps needed to write a page of memory onto SPI Flash. You can include sub-sections for each of your component implementation.
Color Spaces
gray & hsv
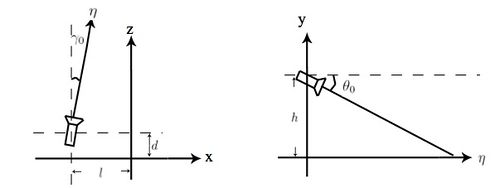
IPM (Inverse Perspective Mapping)
IPM can be thought of as a "bird's eye view" of the road. IPM transforms the perspective of 3-D space into 2-D space, therefore removing the perspective effect. Using this method is advantageous as it focuses directly on the lane marking instead of the surrounding environment. Therefore, reducing a lot of noise.
 Mat findHomography(InputArray srcPoints, InputArray dstPoints, int method=0, double ransacReprojThreshold=3, OutputArray mask=noArray() )
 // can be used to transform perspective from original to IPM
Although IPM was implemented and seemed promising, it was not used in the final version of the code. There was not enough time to further implement and transform/map the IPM coordinates back to the original video. Transforming IPM coordinates back to the original video can be done by:
 cv::getPerspectiveTransform(InputArray src, InputArray dst)   // to get the 3 x 3 matrix of a perspective transform
 cv::perspectiveTransform(inputVector, emptyOutputVector, yourTransformation)   // to transform the your IPM points to original video points
Although implemented and experimented, it was not able to map broken lane markings.
Contours
contour method, then switched to hough
Gaussian Blur
Canny Edge
Hough Line
Percentage offset
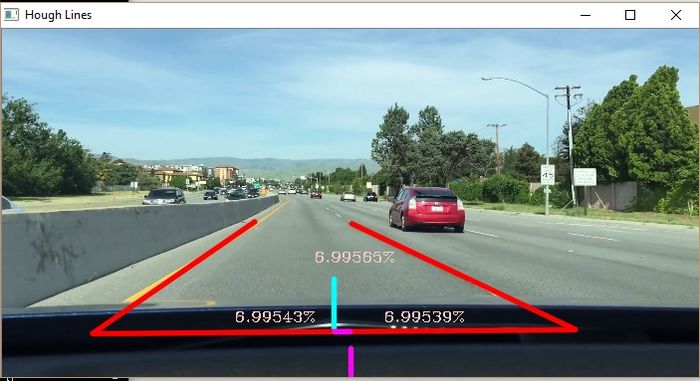
The percentage offset is used to determine how far away the center of the vehicle is from the center of the lane. The percentage offset is calculated when 2 lane markings are detected. It is calculated by using the distance formula (Pythagorean Theorem), using the closest points of the detected lane markings relative to the vehicle.
Three values are displayed:
The left value shows the percentage offset between the distances of left lane to center of lane boundary and to center of vehicle.
The center value shows the percentage offset between the distances from center of lane boundary and center of lane to to center of vehicle.
The right values shows the percentage offset between the distances of right lane to center of lane boundary and to center of vehicle.
Switching Lanes
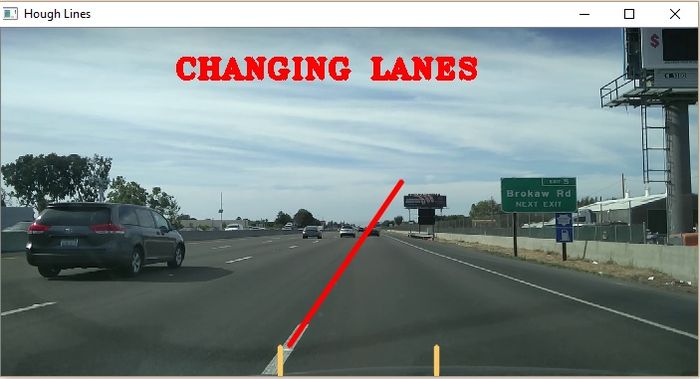
The typical time for an average driver to switch lane takes about one to three seconds. Using this time parameter, we can tell if the driver is switching lanes. The definition of switching lanes is when the driver departs from one lane boundary into another. When departing one lane boundary into another, only one lane will be detected by the camera. When only one lane is detected and within the time parameter, it will check if the lane marking is within a given boundary for it to be considered switching lanes.
Another method implemented to detect switching lanes is to measure the distance between the lane marking to the center of the vehicle (camera). As the distance decrease between a certain distance threshold and time, it will be considered switching lanes. The distance is also calculated using the distance formula.
Testing & Technical Challenges
Describe the challenges of your project. What advise would you give yourself or someone else if your project can be started from scratch again? Make a smooth transition to testing section and described what it took to test your project.
Include sub-sections that list out a problem and solution, such as:
Issue 1: Noise
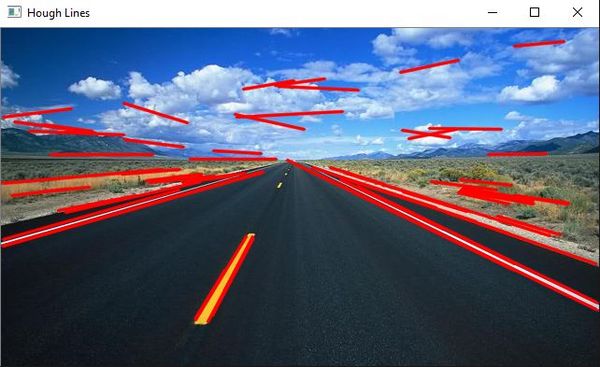
There are Large amounts of noise when generating Hough lines. This is because there are lines in each picture. Standard Hough lines do not work because you cannot set the minimum and maximum lengths of lines. Probabilistic Hough Lines are the best bet for this task. Even with Probabilistic Hough Lines, there is still quite a bit of noise.
Solution:
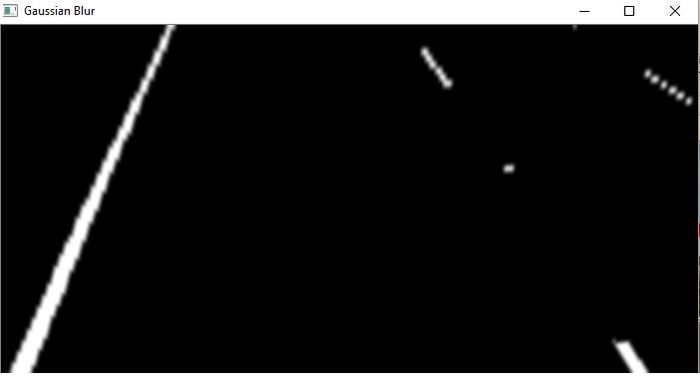
We did not use Probabalistic Hough Line. We used the standard one. Instead of using the Gaussian Blur, converting the image to HSV and then binarizing(threshold) it was sufficient. Adjusting HSV and threshold allows us to just the lanes. This is not perfect because there will still be some noise. To filter out more of the noise, we filtered out unnecessary horizontal angles because lanes from the driver point of view, is not horizontal, but slanted vertically. We filtered between the angles of 15 and 60 degrees for the left lane, and 115 and 145 degrees for the right lane. Erosion was also used to make the lanes appear thinner so we could get a better average.
Issue 2: Broken Lane Markings
Conclusion
Conclude your project here. You can recap your testing and problems. You should address the "so what" part here to indicate what you ultimately learnt from this project. How has this project increased your knowledge?
Project Video
Upload a video of your project and post the link here.
Project Source Code
References
Acknowledgement
Any acknowledgement that you may wish to provide can be included here.
References Used
List any references used in project.
Appendix
You can list the references you used.

