Difference between revisions of "F17: Optimus"
Proj user5 (talk | contribs) (→Software Design) |
Proj user5 (talk | contribs) (→Android Application) |
||
| Line 833: | Line 833: | ||
* OPTIMUS HOME | * OPTIMUS HOME | ||
| − | [[ File: Optimus Home. | + | [[ File: Optimus -- Home.gif|600px|thumb|center|| OPTIMUS HOME]]<br> |
==== Features ==== | ==== Features ==== | ||
| Line 861: | Line 861: | ||
* OPTIMUS DASHBOARD | * OPTIMUS DASHBOARD | ||
| − | [[ File: Dashboard.png| | + | [[ File: Dashboard.png|600px|thumb|center|| OPTIMUS DASHBOARD]]<br> |
==== ISSUES UNDERGONE ==== | ==== ISSUES UNDERGONE ==== | ||
| Line 872: | Line 872: | ||
3. Google Route's are calculated from any point on the ground to the nearest offset point on the pre-drawn custom Google poly-line path as a result the route from certain locations ended up to be on the sharp edge routes rather than smooth curves which also led to little longer routes.<br> | 3. Google Route's are calculated from any point on the ground to the nearest offset point on the pre-drawn custom Google poly-line path as a result the route from certain locations ended up to be on the sharp edge routes rather than smooth curves which also led to little longer routes.<br> | ||
| − | [[ File: Routes.jpg| | + | [[ File: Routes.jpg|600px|thumb|center|| Navigation and Route Selection]]<br> |
* '''Application Compatibility'''<br> | * '''Application Compatibility'''<br> | ||
| Line 889: | Line 889: | ||
** b. Geodesy Engineering Approach.<br> | ** b. Geodesy Engineering Approach.<br> | ||
| − | [[ File: Nearest_Route_Algorithm.gif| | + | [[ File: Nearest_Route_Algorithm.gif|600px|thumb|center|| Source:wikipedia.org::Dijkstra's algorithm]]<br> |
Geodesy approach is complex and can be implemented using 'Haversine' technique to calculate the intermediate points between two points along the geographic surface of the earth but since the distances for the demo were not so long enough that can be significantly impacted by the curvature we decided to go with the primary approach.<br> | Geodesy approach is complex and can be implemented using 'Haversine' technique to calculate the intermediate points between two points along the geographic surface of the earth but since the distances for the demo were not so long enough that can be significantly impacted by the curvature we decided to go with the primary approach.<br> | ||
| Line 903: | Line 903: | ||
* MARKERS | * MARKERS | ||
| − | [[ File: Map Markers.png| | + | [[ File: Map Markers.png|600px|thumb|center|| Map Markers]]<br> |
'''2. screen recording of dashboard'''<br> | '''2. screen recording of dashboard'''<br> | ||
Revision as of 03:51, 19 December 2017
Contents
- 1 Optimus
- 2 Abstract
- 3 Objectives & Introduction
- 4 Team Members & Responsibilities
- 5 Project Schedule
- 6 Parts List & Cost
- 7 CAN Communication
- 8 DBC File
- 9 Hardware & Software Architecture
- 10 Motor Controller
- 10.1 Design & Implementation
- 10.2 Hardware Design
- 10.3 Motor Module Hardware Interface
- 10.4 Software Design
- 10.5 Motor Module Implementation
- 10.6 Testing & Technical Challenges
- 10.7 Sensor Controller
- 10.7.1 Introduction
- 10.7.2 Hardware Implementation
- 10.7.3 Software Implementation
- 10.7.3.1 Approach for obtaining the data from the LIDAR
- 10.7.3.2 Algorithm for interfacing LIDAR to SJOne board and obtaining the obstacle info
- 10.7.3.3 Flowchart for Communicating with the LIDAR and receiving obstacle information
- 10.7.3.4 Testing the data obtained from the LIDAR
- 10.7.3.5 CAN DBC messages sent from the Sensor Controller
- 10.8 Android Application
- 10.9 Bluetooth Controller
- 10.10 Geographical Controller
- 10.11 Software Design
- 10.12 Implementation
- 10.13 Testing & Technical Challenges
- 10.14 PCB Design
- 10.15 Git Project Management
- 11 Common Technical Challenges
- 12 Project Videos
- 13 Conclusion
- 14 Project Source Code
- 15 References
- 16 Acknowledgement
Optimus
Optimus - Self Navigating R/C Car powered by SJOne(LPC1758) micro controller.
Abstract
The aim of the project is to build a Self-driving Car that goes from point A to point B with obstacle avoidance. The self-driving car contains five modules these are Master Module, Geo, Sensor, Motor, and Bridge module. We have also built an Android application that communicates with our car through Bridge controller. Android application is used to give destination point where we want our car to go. The Android application also shows all Car Input and output information like obstacles information around the car, the car's heading angle, destination reached flag and more.
Objectives & Introduction
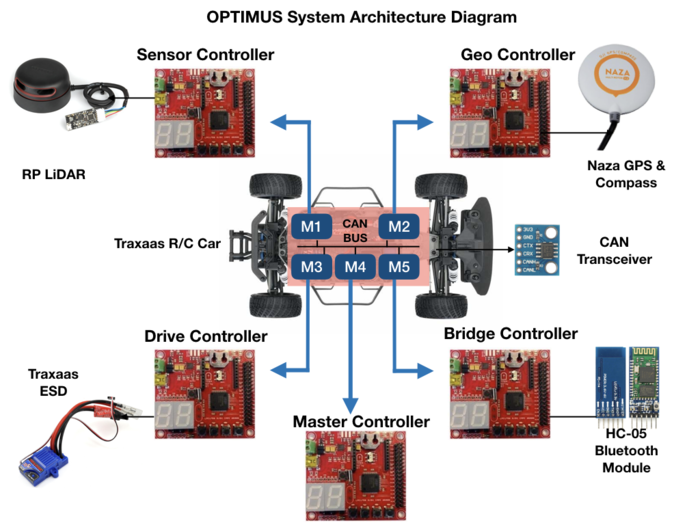
There are five controller which are part of Self-driving car these are:
Sensor Controller: Sensor controller user RPLIDAR to scan its 360-degree environment within 6-meter range. it sends this data to master controller and bridge controller.
Geo Controller: Geo controller user NAZA GPS module that provides car current GPS location and compass angle. Geo controller also calculates heading and bearing angle that helps the car to turn in destination direction.
Drive Controller: Drive controller drives the motor based on the commands it receives from the Master.
Bridge Controller: Bridge controller works as a gateway between the Android application and Self-driving car and passed information to/from between them.
Master Controller: Master controller controls all the control, it decides when and what command it should give it to other controllers.
Android Application:
The android application gives option user to provide the final destination where our car should go. The Android application also shows all Car input and output information.
Team Members & Responsibilities
- Motor Controller
- Unnikrishnan
- Rajul
- Android and Communication Bridge
- Parimal
- Kripanand Jha
- Unnikrishnan
- Geographical Controller:
- Master Controller:
- Revathy
- Sensor and I/O Controller:
- Sushma
- Supradeep
- Harshitha
- Integration Testing
- Unnikrishnan
- Sneha
- Kripanand Jha
- PCB Design
Project Schedule
Legend:
Major Feature milestone , CAN Master Controller , Sensor & IO Controller , Android Controller, Motor Controller , Geo , Testing, Ble controller, Team Goal
| Week# | Date | Planned Task | Actual | Status |
|---|---|---|---|---|
| 1 | 9/23/2017 |
|
|
Complete. |
| 2 | 9/30/2017 |
|
|
Complete |
| 3 | 10/14/2017 |
|
|
Complete |
| 4 | 10/21/2017 |
|
|
complete |
| 5 | 10/28/2017 |
|
|
Complete |
| 6 | 11/07/2017 |
|
|
Complete |
| 7 | 11/14/2017 |
|
|
Complete. |
| 8 | 11/21/2017 |
|
|
Complete. |
| 9 | 11/28/2017 |
|
|
Complete. |
| 10 | 12/5/2017 |
|
|
Complete |
| 11 | 12/12/2017 |
|
|
On Track |
Parts List & Cost
The Project bill of materials is as listed in the table below.
| SNo. | Component | Units | Total Cost |
|---|---|---|---|
| General System Components | |||
| 1 | SJ One Board (LPC 1758) | 5 | $400 |
| 2 | Traxaas RC Car | 1 | From Prof. Kaikai Liu |
| 3 | CAN Transceivers | 15 | $55 |
| 4 | PCAN dongle | 1 | From Preet |
| 5 | PCB Manufacturing | 5 | $70 |
| 6 | 3D printing | 2 | From Marvin |
| 6 | General Hardware components( Connectors,standoffs,Soldering Kits) | 1 | $40 |
| 7 | Power Bank | 1 | $41.50 |
| 8 | LED Digital Display | 1 | From Preet |
| 9 | Acrylic Board | 1 | $12.53 |
| Sensor/IO Controller Components | |||
| 10 | RP Lidar | 1 | $449 |
| Geo Controller Components | |||
| 11 | GPS Module | 1 | $50 |
| Bluetooth Bridge Controller Component | |||
| 12 | Bluetooth Module | 1 | $34.95 |
| Drive Controller Component | |||
| 13 | RPM Sensor | 1 | $20 |
CAN Communication
System Nodes : MASTER , MOTOR , BLE , SENSOR , GEO
| SNo. | Message ID | Message from Source Node | Receivers |
|---|---|---|---|
| Master Controller Message | |||
| 1 | 2 | System Start command to start motor | Motor |
| 2 | 17 | Target Speed-Steer Signal to Motor | Motor |
| 3 | 194 | Telemetry Message to Display it on Android | BLE |
| Sensor Controller Message | |||
| 4 | 3 | Lidar Detections of obstacles in 360 degree grouped as sectors | Master,BLE |
| 5 | 36 | Heartbeat | Master |
| Geo Controller Message | |||
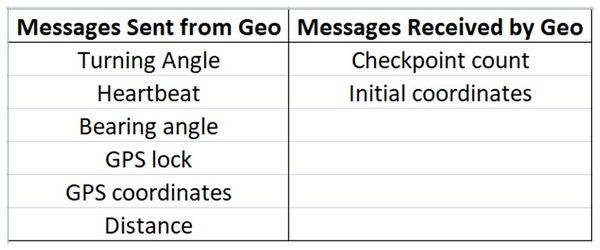
| 6 | 195 | Compass, Destination Reached flag, Checkpoint id signals | Master,BLE |
| 7 | 4 | Turning Angle | Master,BLE |
| 8 | 4 | Heartbeat | Master |
| Bluetooth Bridge Controller Message | |||
| 9 | 1 | Send start command received from Android app to master | Master |
| 10 | 38 | Heartbeat | Master |
| 11 | 213 | Checkpoint Count from AndroidApp | Geo |
| 12 | 212 | Checkpoints (Lat, Long) from Android App | Geo |
DBC File
https://gitlab.com/optimus_prime/optimus/blob/master/_can_dbc/243.dbc
Hardware & Software Architecture
Master Controller Design & Implementation
Software Architecture Design
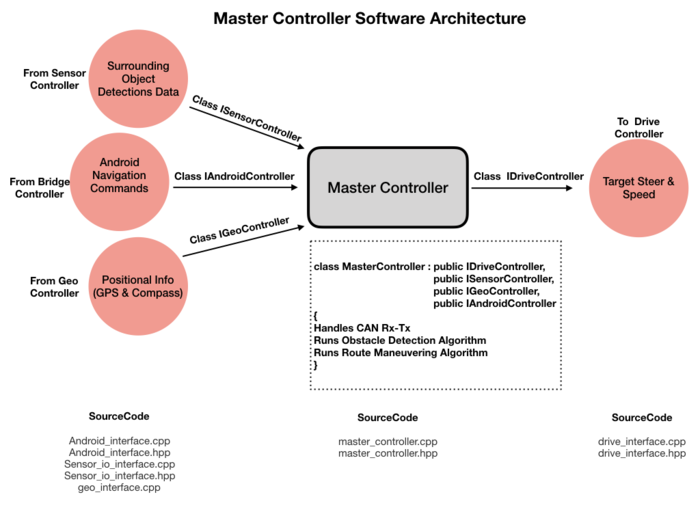
The Master Controller Integrates the functionality of all other controllers and it acts as the Central Control Unit of the R/C car. Two of the major functionalities handled by Mater Controller is Obstacle avoidance and Route Maneuvering.
The overview of Master Controller Software Architecture is to show in the below figure.
As an analogy to Human driving, it receives the inputs from sensors to determine the surrounding of the R/C car and take decisions based on the environments and commands from the user. The input data it receives includes the following. The output of the Master controller is to direct the Motor with target Speed and Steering direction.
1. Lidar Object Detections - To determine if there is an obstacle in the path of navigation
2. GPS and Compass Reading - To understand the Heading and Bearing angle to decide the direction of movement
3. User command from Android - To stop or Navigate to the Destination
Software Implementation
The Master controllers run 2 major algorithms, Route Maneuvering and Obstacle Avoidance. The System start /stop is handled by master based on the Specific commands. The implicit requirement is that When the user selects the destination and route are calculated, the checkpoints are sent from Android through bridge controller. So, Once Geo Controller receives a complete set of checkpoints, the master controller starts the system based on the "Checkpoint ID". If the ID is a non-zero value, the route has started and Master controller runs the RouteManuveringAlgorithm.
The Overall control flow of master controller is shown in the below figure.
Testing and Challenges
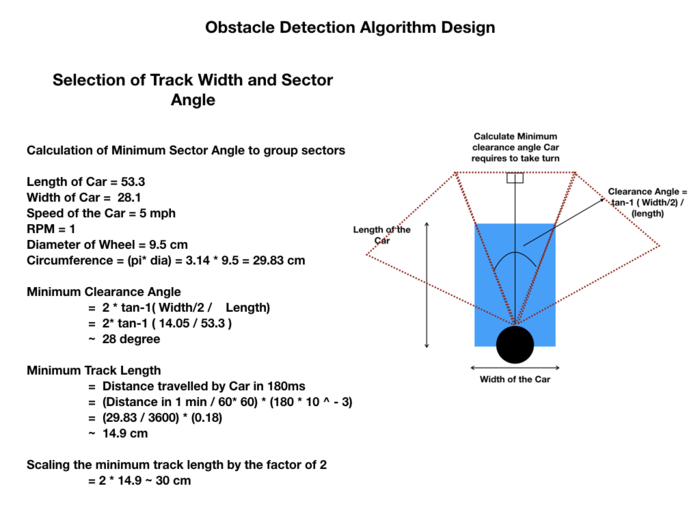
The critical part in Obstacle Avoidance Algorithm is designing as two parts, 1. Detect obstacles 2. Avoid Obstacles. Since we get 360-degree view of obstacles, we need to group the zones into sectors and tracks to process the 360-degree detections and take decision-based
To Add:
Debug LEDs map
GPIO interface to led, CAN txrx
Unit testing
Motor Controller
Design & Implementation
The Motor Controller is responsible for the Movement and Steering action of the Car. It includes two types of motors, DC motor for movement and DC Servo motor for Steering. The Motor has an inbuilt driver called ESC (Electronic Speed Control) Circuit used the manipulate the speed and steering of the Car. It has a PWM input for both Servo Motor and DC Motor. We are using RPM sensor to take the feedback from the motor to monitor the speed.
Hardware Design
| SJOne Pin Diagram | ||
|---|---|---|
| Sr.No | Pin Number | Pin Function |
| 1 | P0.1 | HEADlIGHTS |
| 2 | P1.19 | BRAKELIGHTS |
| 3 | P1.20 | LEFT INDICATORS |
| 4 | P1.22 | RIGHT INDICATORS |
| 5 | P0.26 | RPM SENSOR |
| 6 | P2.0 | SERVO PWM |
| 7 | P2.1 | MOTOR PWM |
- Hardware Specifications
1. DC Motor, Servo and ESC
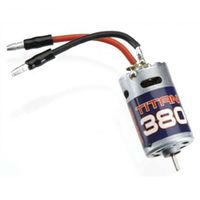
This is a Traxxas Titan 380 18-turn brushed motor. The DC motor comes with the Electronic Speed Control(ESC) module. The ESC module can control both servo and DC motor using Pulse Width Modulation (PWM) control. ESC also requires an initial calibration:
1. Connect a fully charged battery pack to the ESC.
2. Turn on the transmitter (with the throttle at neutral).
3. Press and hold the EZ-Set button (A). The LED will first turn green and then red. Release the EZ-Set button.
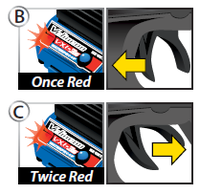
4. When the LED blinks RED ONCE, pull the throttle trigger to the full throttle position and hold it there (B).
5. When the LED blinks RED TWICE, push the throttle trigger to the full reverse and hold it there (C).
6. When the LED blinks GREEN ONCE, programming is complete. The LED will then shine green or red (depending on low-voltage detection setting) indicating the ESC is on and at neutral (D).
Once, the Calibration is done, ESC is ready to be operated with PWM Signals. The DC motor PWM is converted in the range of -100% to 100% where -100% means "reverse with full speed", 100% means "forward with full speed" and 0 means "Stop or Neutral".
Also, servo can also be operated in Safe manner using PWM. Here are some notes on how not to blow a servo motor:
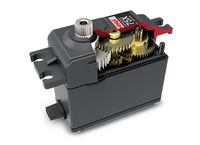
As we need a locked 0 –> 180 degrees motion in certain applications like robot arm, Humanoids etc. We use these Servo motors. These are Normal motors only with a potentiometer connected to its shaft which gives us the feedback of analog value and adjusts its angle according to its given input signal.
So… How to Operate it?
A servo usually requires 5V->6V As VCC. (As i am Talking about hobby servos that all the other hobbyists use.. Industrial servos requires more.) and Ground and a signal to adjust its position.
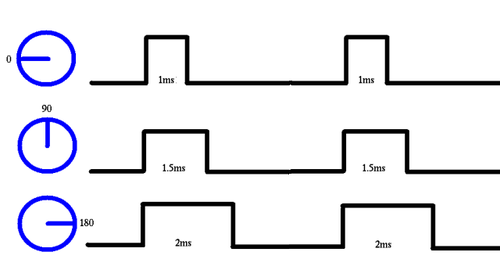
The signal is a PWM waveform. For a servo we need to provide a PWM of frequency about 50Hz-200Hz (Refer the datasheet). so the time duration of a clock cycle goes to 20ms. From this 20ms if the On time is 1ms and off time is 19ms we generally get the 0 degrees position. And when we increase the duty cycle from 1ms to 2ms the angle changes from 0–> 180 degrees.
So where can it go wrong-
Power->> The power we provide. Generally we tend to give a higher volt batteries for our applications by pulling the voltage down through regulators to 5Vs. But we surely can-not give supply to the servo through our uC as the servo eats up a hell lot of current and the one which i use i.e. Atmega16 can mostly source only up to 200mA so it will totally burn it.
Another way to burn the servo is at certain times the supply is given directly through the battery so the uC will not blow up. But if you Give a supply say 12Volts then boom. Your servo will go own for ever.
PWM–> PWM should strictly be in the range between 1ms–> 2ms (refer datasheets) If by any mistakes the PWM goes out then boom the servo will start jittering and will heat up and heat up and will burn itself down. But this problem is easily identifiable as there is a jitter sound which if you have got enough experience with servos, you will totally notice the noise. So if the noise is there when you turn on the servo, turn it off right away and change the code ASAP.
Load— Hobby servos don’t have high load bearing capacities and as it is designed that way it always tries to adjust its angle according to signal. But here is the catch. As there is too much off load the servo cannot go further and the signal is forcing it to. So again.. heat… heat and boom. How to avoid this. Give load to the servo only in the figure of safety.
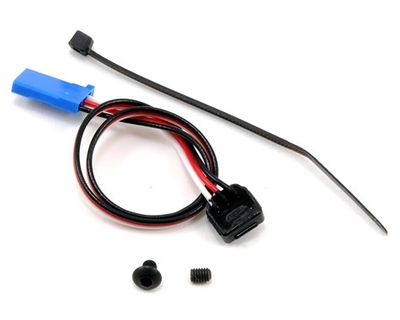
2. RPM Sensor =
This is an optional Traxxas "short" RPM Sensor. To collect critical RPM data (Revolutions Per Minute), a "trigger magnet" is installed in the spur gear of electric models, or the flywheel of nitro vehicles. To offset the weight of the magnet, additional material is molded or cast into the opposite side of the spur gear or flywheel. To read the magnet, a hall effect sensor is installed in the gear cover (electric models) or installed on a support arm (nitro models).
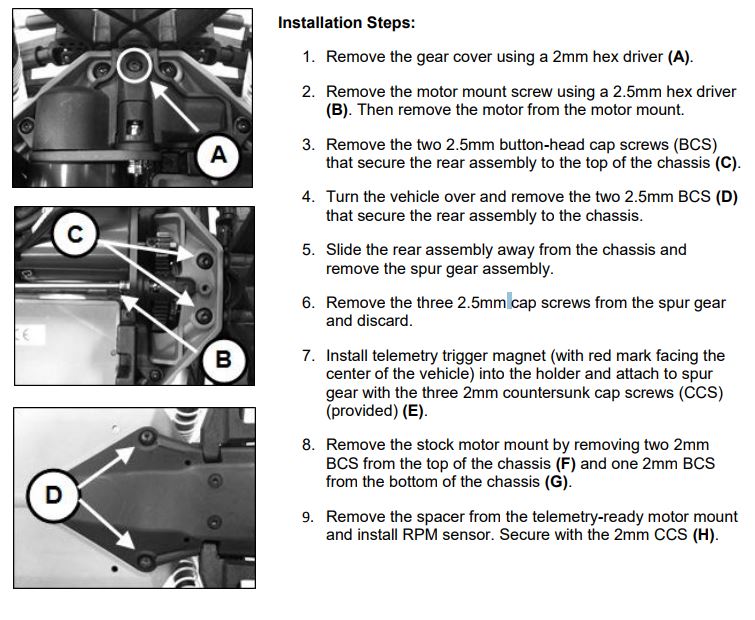
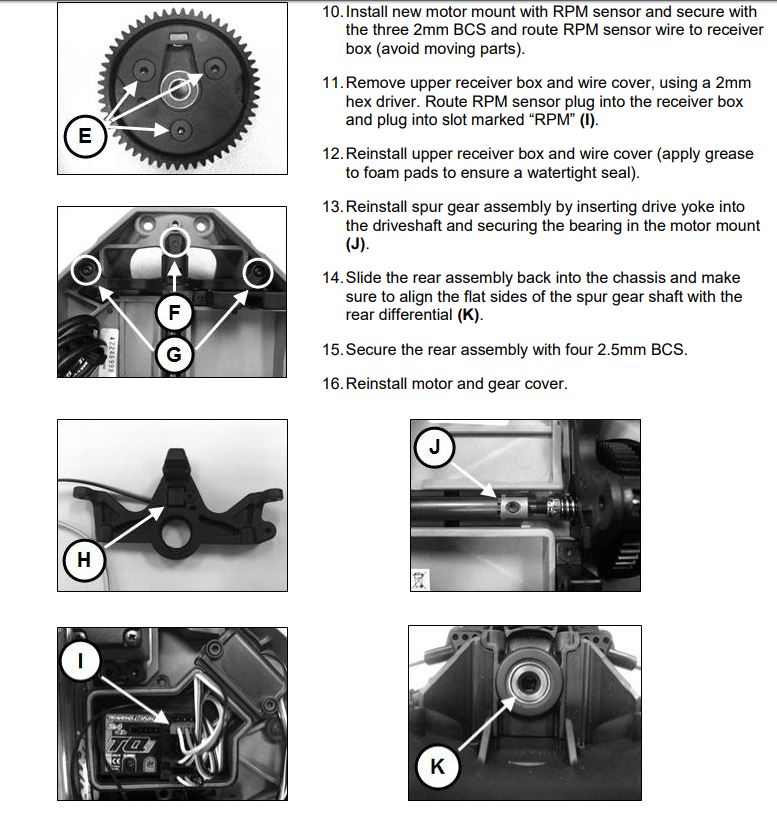
The RPM sensor above requires a specific kind of Installation. STEPS ARE:
Once the installation is done, the RPM can be read using the above magnetic RPM sensor. It gives a high pulse at every rotation of the wheel. Hence, to calculate the RPM, the output of the above sensor is fed to a gpio pin of SJOne board.
Motor Module Hardware Interface
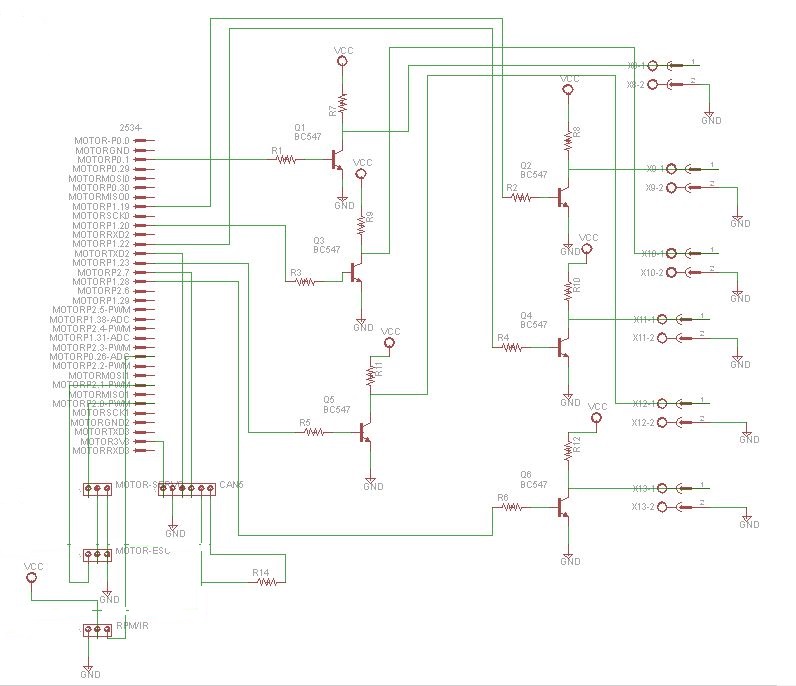
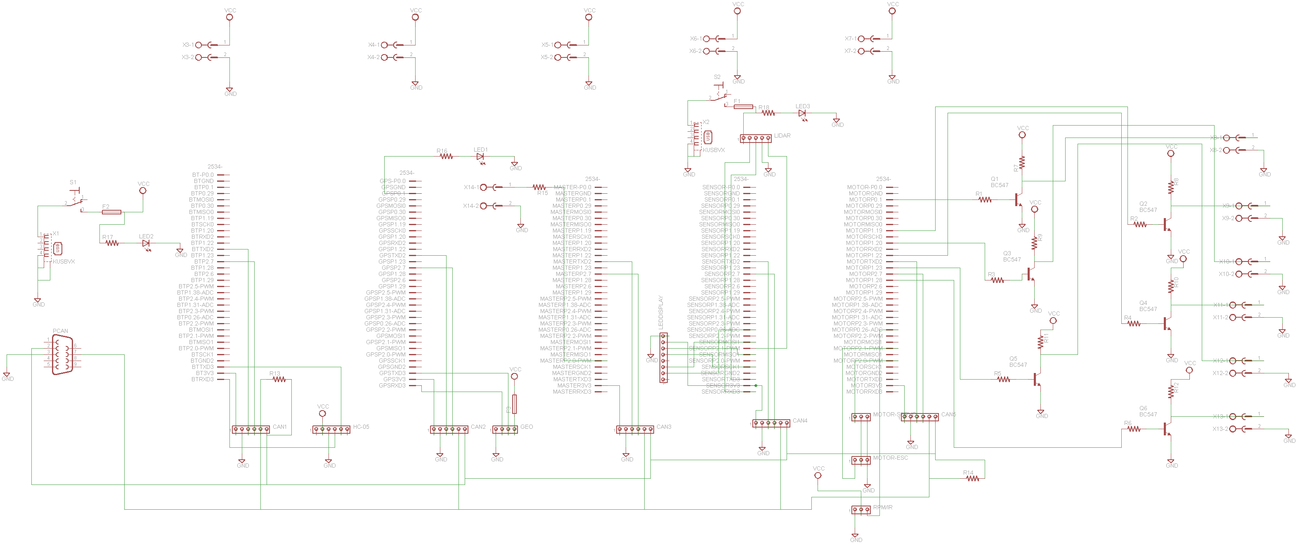
The Hardware connections of Motor Module is shown in above Schematic. The motor receive signals through CAN bus from the Master and feedback is sent via RPM sensor to the Master as current speed of the Car. The speed sent from a RPM sensor over a CAN bus is also utilized by I/O Module and BLE module to print the values on LED display and Android App.
Software Design
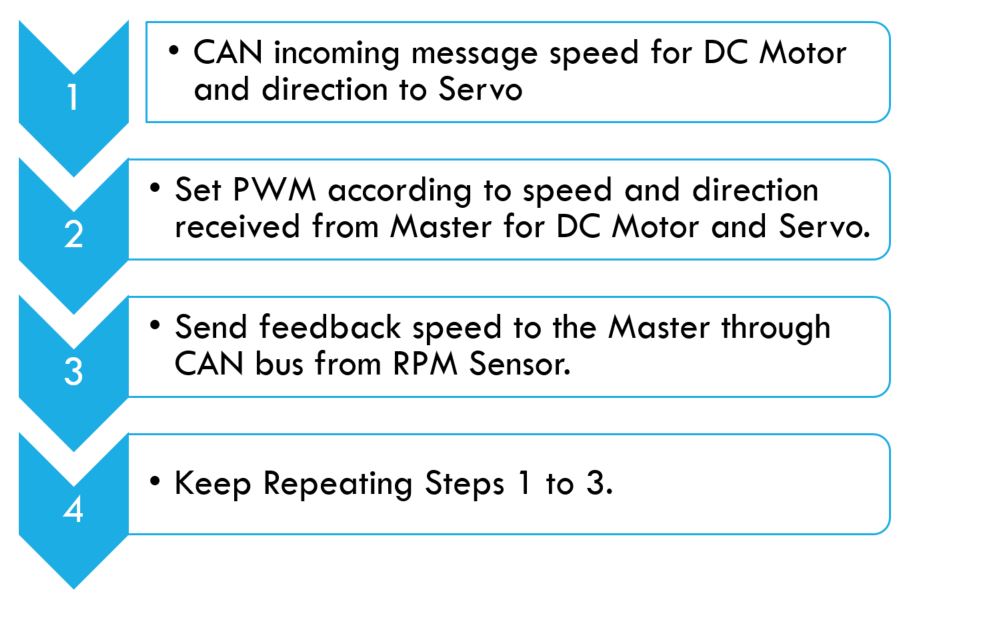
The following diagram describes the flow of the software implementation for the motor driver and speed feedback mechanism.
Motor Module Implementation
The motor controller is operated based on the CAN messages received from the Master. The CAN messages for Drive and Steer commands are sent from the Master Controller. Motor controller converts the value received from Master (+100 to -100 for Drive Speed percent and +100 to -100 for Steer angle in the range of 1 to 180 degrees turn) into specific PWM value as required by DC motor and Servo.
- Speed Regulation:
Upon detection of uphill the pulse frequency from RPM Sensor reduces, that means car is slowing down. Hence, in that scenario, car is accelerated (increase PWM) further to maintain the required speed. Similarly in case of Downhill pulse frequency increases, which means car is speeding up. Hence, brakes (reduced PWM) are applied to compensate the increased speed.
Testing & Technical Challenges
1) ESC Calibration
We messed up the calibration on the ESC.
XL 5 had a long press option to calibrate the ESC, where the ESC shall:
a) After long press, glow green and start taking PWM signals for neutral (1.5).
b) Glow green once again where we shall feed in PWM signals for Forward (2ms).
b) Glow green twice again where we shall feed in PWM signals for Reverse (1ms)."
-We wrote code to calibrate using EXT-INT (EINT3) over P0.1 - switch to calibrate the ESC this way!
2) ESC Reverse
The ESC was not activating reverse if we directly - as in the datasheet (no formal datasheet - only XL 5 forums - talked about 1ms pulse width at 50Hz for reverse).
We figured out that Reverse is actually 3 steps:
a) goNeutral()
b) goReverse()
c) goNeutral()
d) goReverse()
3) RPM Sensor Installation:
After following the steps to install RPM sensor (as steps above), the RPM sensor was not detecting the Rotation (magnet) of the wheel.
The reason for that was Machine steeled pinion gear and slipper clutch. The Machine steeled pinion gear and slipper clutch that came with the RC car was big. That increased the distance between Magnet and RPM sensor. That's why we were not able to detect RPM of wheel.
We even checked the activity using Digital Oscilloscope.
Then we changed the smaller Machine steeled pinion gear and slipper clutch and reinstalled the RPM sensor and it worked.
Sensor Controller
The Sensor is for detecting and avoiding obstacles. For this purpose we have used RPLIDAR by SLAMTEC.
Introduction
The RPLIDAR A2 is a 360 degree 2D laser scanner (LIDAR) solution developed by SLAMTEC. It can take up to 4000 samples of laser ranging per second with high rotation speed. And equipped with SLAMTEC patented OPTMAG technology, it breakouts the life limitation of traditional LIDAR system so as to work stably for a long time. The system can perform 2D 360-degree scan within a 6-meter range. The generated 2D point cloud data can be used in mapping, localization and object/environment modeling. The typical scanning frequency of the RPLIDAR A2 is 10hz (600rpm).Under this condition, the resolution will be 0.9°. And the actual scanning frequency can be freely adjusted within the 5-15hz range according to the requirements of users. The RPLIDAR A2 adopts the low cost laser triangulation measurement system developed by SLAMTEC, which makes the RPLIDAR A2 has excellent performance in all kinds of indoor environment and outdoor environment without direct sunlight exposure.
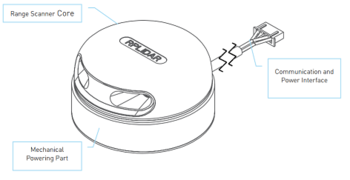
This LIDAR consists of a range scanner core and the mechanical powering part which makes the core rotate at a high speed. When it functions normally, the scanner will rotate and scan clockwise. And users can get the range scan data via the communication interface of the RPLIDAR (UART) and control the start, stop and rotating speed of the rotate motor via PWM.
A laser beam is sent out by the transmitter and the reflected laser beam is received back. Depending on the time taken to receive the beam back, the distance of the obstacle is calculated. If there is no obstacle, the beam will not be reflected back.
Hardware Implementation
Specifications of the LIDAR
The specifications of the LIDAR as mentioned in the datasheet are as follows:
Power Supply: 5V
Serial Communication interface: UART
Baud Rate for the UART: 115200
Working mode of the UART: 8N1
PWM Maximum Voltage: 5V (Typical 3.3V)
PWM frequency: 25KHz
Duty Cycle of the PWM wave: 60% - 100%
Connections to the SJOne Board
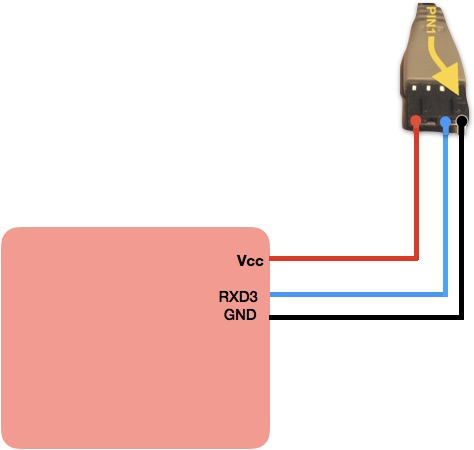
The LIDAR works with a UART interface and hence has been connected to the UART3 pins of of the SJOne board i.e. P4.28 and P4.29. As the LIDAR needs a 5V supply, it is provided from the PCB (which is powered through a power bank) instead of the SJOne board which can supply only 3.3V. The connections can be seen in the figure below.
Software Implementation
Approach for obtaining the data from the LIDAR
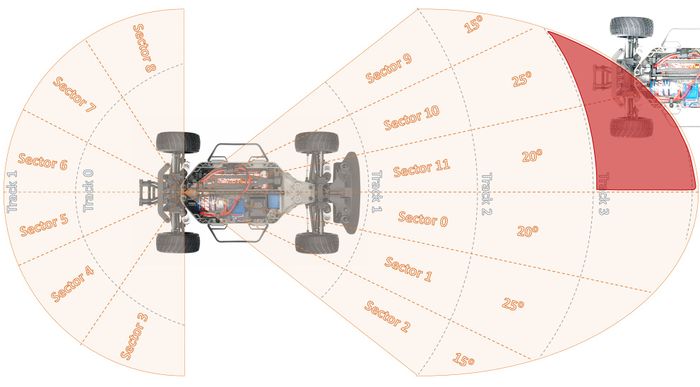
The LIDAR senses all the obstacles around it (360 degrees upto a range of 6000cm) one degree at a time. This means that for one rotation of the LIDAR WE GET 360 values i.e. 360 angles with their corresponding obstacle information. It takes 180ms for the LIDAR to complete one 360 degree scan. Since we do not need obstacle information for each and every angle, we group a few angles together into "sectors" and consider the nearest object present in a sector as an obstacle. To identify how far an obstacle is located, the distance values are grouped into "tracks" i.e 0cm to 25cm is track 1 and 25cm to 50cm is track 2 and so on. The motor will take action depending on the track in which an obstacle is present.
Algorithm for interfacing LIDAR to SJOne board and obtaining the obstacle info
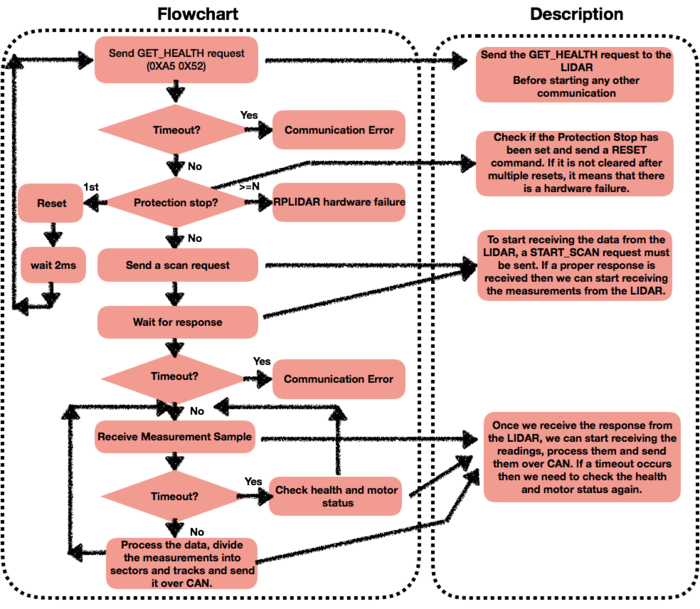
Step 1: Send a GET_HEALTH (0XA5 0X52) Request. If the receive times out it is a communication error.
Step 2: Check if a ‘protection stop’ is happening. If it is happening then send a RESET (0XA5 0X40). Again check for ‘protection stop’ and if it it still set, send a RESET again. If ‘protection stop’ is set even after sending RESET multiple times it means there is a hardware defect. If there is no hardware defect, proceed to the next step.
Step 3: Send a START_SCAN (0XA5 0X20) request. Wait for the response header. If there is no timeout, read the measurement sample. Otherwise check HEALTH_STATUS and MOTOR_STATUS again. Send START_SCAN again.
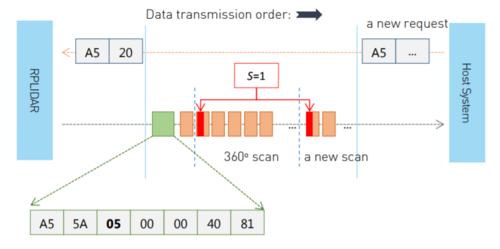
Step 4: Continuously read the measurement samples.The data sent from the LIDAR will contain the start bit, angle, distance and quality. The start bit is set to 1 after every single 360 degree scan. The angle and distance represent to the motor angle and the obstacle in that corresponding angle. The quality represents the strength of the reflected beam. If the quality is zero it means that there is no obstacle in that direction. This data is processed to be group the information into sectors and tracks.
Step 5: If we wish to stop the readings, send a STOP (0XA5 0X25) request. This is the end of operation.
Flowchart for Communicating with the LIDAR and receiving obstacle information
The entire flowchart for communicating with the LIDAR and receiving data from it is shown in the figure below:
Testing the data obtained from the LIDAR
To perform the initial testing of the LIDAR and to check if we are getting the correct obstacle info, we have made a setup enclosing the LIDAR on all four sides. So, by plotting the distance info given by the LIDAR in Microsoft Excel we can visualize a map of the obstacles as detected by the LIDAR. The map plotted in Excel after closing almost all four sides of the LIDAR can be shown in the figure shown below.
[Figure of a plot of the LIDAR readings (done in Excel) will be added]
CAN DBC messages sent from the Sensor Controller
The data received from the LIDAR is grouped into sectors and tracks and is sent over the CAN bus. The CAN DBC messages in the DBC file will be as follows
BO_ 3 SENSOR_LIDAR_OBSTACLE_INFO: 6 SENSOR
SG_ SENSOR_LIDAR_OBSTACLE_INFO_SECTOR0 : 0|4@1+ (1,0) [0|12] "" MASTER,BLE
SG_ SENSOR_LIDAR_OBSTACLE_INFO_SECTOR1 : 4|4@1+ (1,0) [0|12] "" MASTER,BLE
SG_ SENSOR_LIDAR_OBSTACLE_INFO_SECTOR2 : 8|4@1+ (1,0) [0|12] "" MASTER,BLE
SG_ SENSOR_LIDAR_OBSTACLE_INFO_SECTOR3 : 12|4@1+ (1,0) [0|12] "" MASTER,BLE
SG_ SENSOR_LIDAR_OBSTACLE_INFO_SECTOR4 : 16|4@1+ (1,0) [0|12] "" MASTER,BLE
SG_ SENSOR_LIDAR_OBSTACLE_INFO_SECTOR5 : 20|4@1+ (1,0) [0|12] "" MASTER,BLE
SG_ SENSOR_LIDAR_OBSTACLE_INFO_SECTOR6 : 24|4@1+ (1,0) [0|12] "" MASTER,BLE
SG_ SENSOR_LIDAR_OBSTACLE_INFO_SECTOR7 : 28|4@1+ (1,0) [0|12] "" MASTER,BLE
SG_ SENSOR_LIDAR_OBSTACLE_INFO_SECTOR8 : 32|4@1+ (1,0) [0|12] "" MASTER,BLE
SG_ SENSOR_LIDAR_OBSTACLE_INFO_SECTOR9 : 36|4@1+ (1,0) [0|12] "" MASTER,BLE
SG_ SENSOR_LIDAR_OBSTACLE_INFO_SECTOR10 : 40|4@1+ (1,0) [0|12] "" MASTER,BLE
SG_ SENSOR_LIDAR_OBSTACLE_INFO_SECTOR11 : 44|4@1+ (1,0) [0|12] "" MASTER,BLE
Android Application
Description
An Android Mobile Device Application to Navigate and trigger power to the Self Driving Car "OPTIMUS".
Optimus App serves an important role in the SDLC as it integrates the UI alongwith RC Controls like "Power", "Navigation" over Bluetooth channel with the Self navigating CAR.
The App uses RF-Comm Bluetooth Communication protocol and a BLE Transceiver to communicate with CAR and exchange several useful information over a Baud-rate of 9600bps.
Optimus mobile Platform needs to be connected with a specific Device Address based on the BLE Chip type in use.
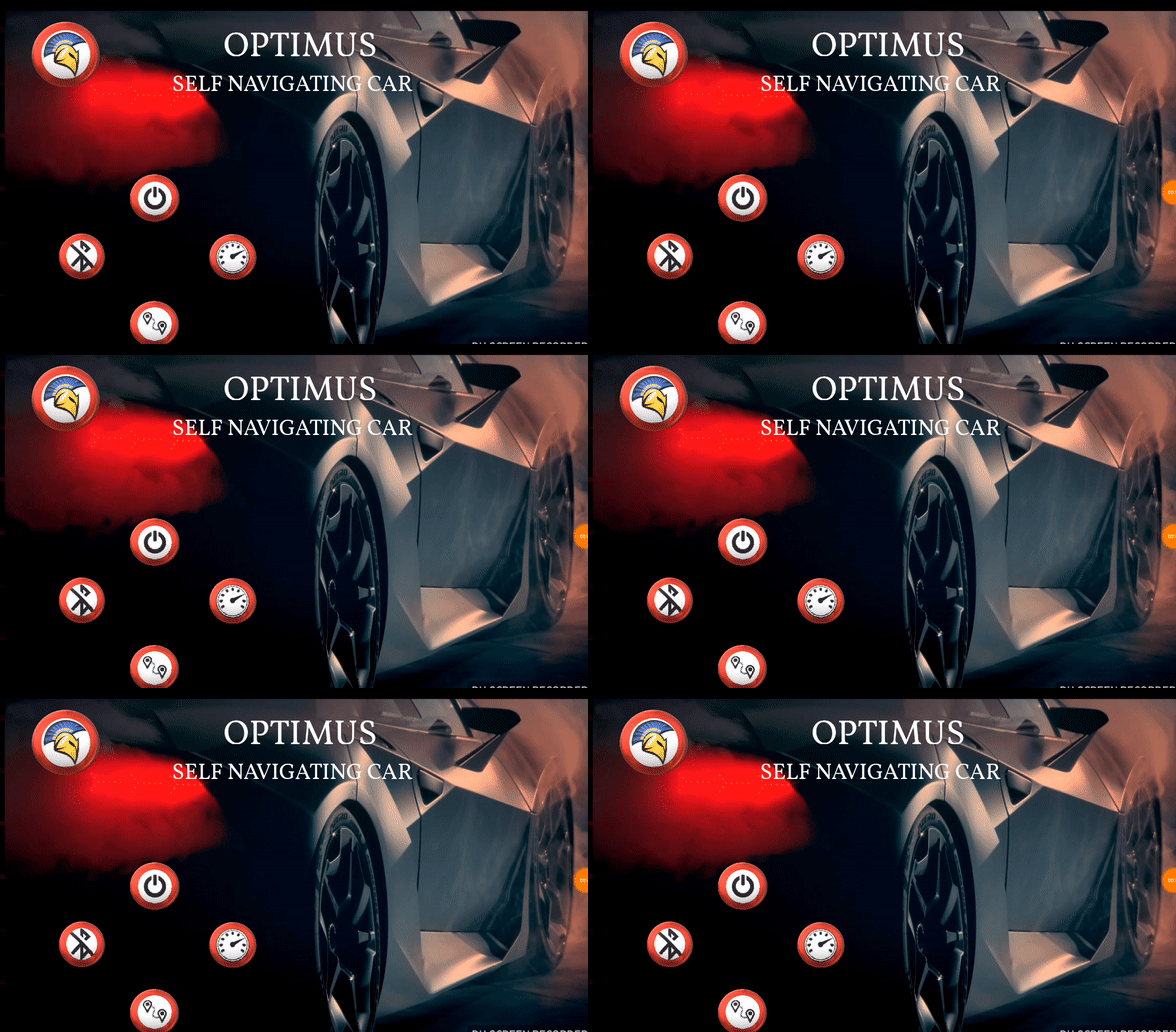
- OPTIMUS HOME
Features
1. BLUETOOTH
The Android mobile application includes support for the Bluetooth network stack, which allows a device to wirelessly exchange data with the HC-05 Bluetooth device.
The Android application framework provides access to the Bluetooth functionality through the Android Bluetooth APIs. These APIs let applications wirelessly connect to other Bluetooth device, enabling point-to-point wireless features.
Using the Bluetooth APIs, Android application performs the following:
- Scan for other Bluetooth device HC-05 on RC Car [00:**:91:D9:14:**]
- Query the local Bluetooth adapter for paired Bluetooth devices
- Establish RFCOMM channels
- Connect to other devices through service discovery
- Transfer data to and from other devices
- Manage multiple connections
2. MAPS
Optimus App uses Google Maps for setting up the Routing Map information and to decide on the next checkpoint for the Car and the appropriate shortest route by computing the checkpoints using "Adjaceny Matrix" and certain algorithms. Google Maps are used along with other promising features to improve the navigation experience as the Route plot and Checkpoint mapping on groovy paths around campus are difficult to plan and route using Google Api(s).
3. DASHBOARD
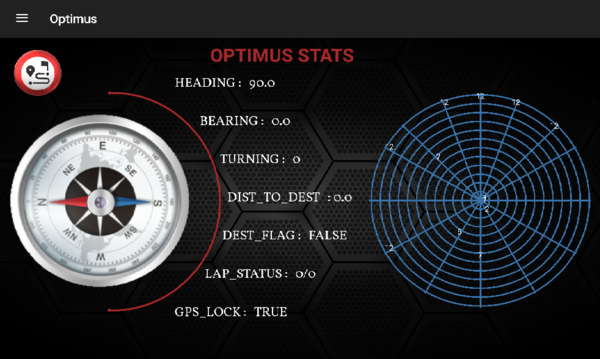
Dash Board was designed to have an at a glance View and to project a UI similar to a CAR Dashboard on the App wherein we have Compass Values, Bearing and Heading Angles, Lidar Maps to resonate the data obtained from LIDAR which also helps in debugging the features and the values being sent from respective Sensor Modules.
- OPTIMUS DASHBOARD
ISSUES UNDERGONE
- MAPS: Plotting Routes and Offline Check Points Calculation
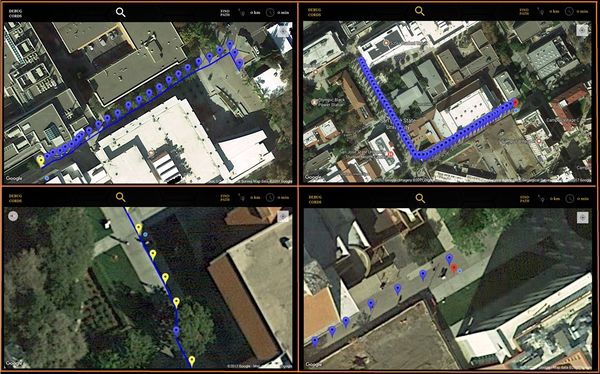
Initial with the use of Google Android Apis we were able to route maps but sooner faced a couple of issues as follows:
1. For Straight Line Routes, often the checkpoints were not received, as according to Google Api's checkpoints are only generated at the intersections where the route bends.
2. Due to the aforesaid drawback on straight routes it was hard to navigate and interpolation was required to make sure the GEO has enough checkpoints to redefine the heading angle before the car goes too far from its destined straight route path.
3. Google Route's are calculated from any point on the ground to the nearest offset point on the pre-drawn custom Google poly-line path as a result the route from certain locations ended up to be on the sharp edge routes rather than smooth curves which also led to little longer routes.
- Application Compatibility
During Implementation one of the issues faced were the security features of Android applications and permissions to use Geo Locations and App Storage.
Every time after fresh app Installation the permissions had to be revisited and enabled for the app to access them, something which still can be upgraded further.
How did we Overcome these challenges?
MAP DEBUGGING & ROUTE CALCULATION
For overcoming the problem with placing routes and calculating the shortest path we decided to interpolate routes in the university premises.
Steps involved:
- Draw polylines routes and calculate checkpoint coordinates and create a json file which will be parsed at the app to get the next checkpoint coordinates.
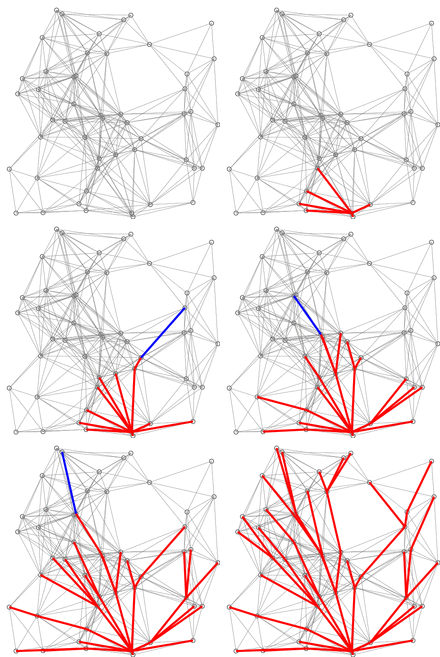
- Use Dijkstra's Algorithm to calculate shortest path between those routes.
- For longer routes two approaches could be taken to calculate the intermediate checkpoints:
- a. Straightline Approach
- b. Geodesy Engineering Approach.
- a. Straightline Approach
Geodesy approach is complex and can be implemented using 'Haversine' technique to calculate the intermediate points between two points along the geographic surface of the earth but since the distances for the demo were not so long enough that can be significantly impacted by the curvature we decided to go with the primary approach.
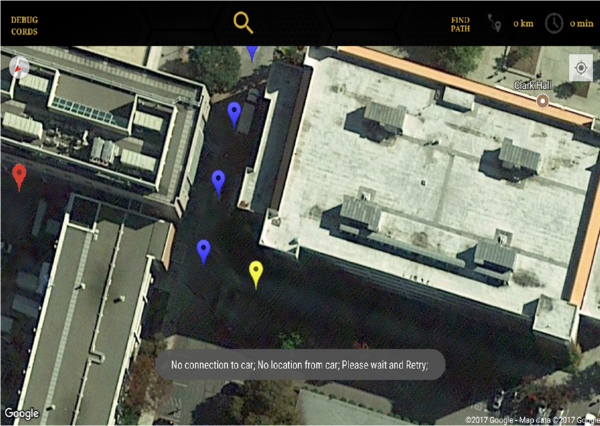
We used Vincenty formula to compute the interpolate points between two checkpoints when the distance between the two exceeded ~(10±5)meters the algorithm will interpolate the route to give intermediate checkpoints which will be marked on the map using BLUE Markers.
For easy user view we added Hybrid TYPE MAP on the app so that user can have a 3D feel of the route.
- We also added colored Markers for denoting following:
  >>> START/STOP : Custom Markers

  >>> CAR LOCATION : Yellow Markers

  >>> INTERMEDIATE CHECKPOINTS : HUE_BLUE Markers
- MARKERS
2. screen recording of dashboard
Bluetooth Controller
Hardware Implementation
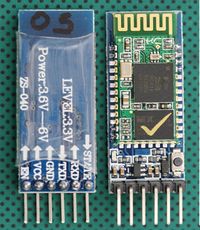
Bluetooth Module: We are using HC-05 Bluetooth module to send and receive the data from our android application.
Pin Configuration:
The Bridge controller is connected to the bluetooth module through the uart serial interface (Uart3) with 9600 baud rate 8-bit data and 1 stop bit.
Software Implementation
Pseudo code of Bridge controller:
1. Turn on bridge controller.
2. Initialise Bluetooth controller with Uart3 settings.
3. Initialise CAN-BUS with 100 kbps speed.
4. Handle Incoming IO messages it received from the Geo and the Sensor over CAN Bus.
5. Send the received CAN message to the Android over Bluetooth each second.
6. Send the heartbeat message every second to the Master controller.
7. Read Bluetooth message it received from the Android app.
8. Forward the Android message to GEO controller if it received checkpoints otherwise forward it to Master.
Periodic Task implementation:
1 Hz task
1. Send Heartbeat message to Master.
2. Send IO messages which are already received from Geo and Sensor controller to the Android app.
3. Read Data from the Bluetooth module.
100 Hz task
1. Read CAN messages.
DBC messages:
Messages sent from Bluetooth controller :
BO_ 1 BLE_START_STOP_CMD: 1 BLE
SG_ BLE_START_STOP_CMD_start : 0|4@1+ (1,0) [0|1] "" MASTER
SG_ BLE_START_STOP_CMD_reset : 4|4@1+ (1,0) [0|1] "" MASTER
BO_ 2 MASTER_SYS_STOP_CMD: 1 MASTER
SG_ MASTER_SYS_STOP_CMD_stop : 0|8@1+ (1,0) [0|1] "" MOTOR
BO_ 38 BLE_HEARTBEAT: 1 BLE
SG_ BLE_HEARTBEAT_signal : 0|8@1+ (1,0) [0|255] "" MASTER
BO_ 212 BLE_GPS_DATA: 8 BLE
SG_ BLE_GPS_long : 0|32@1- (0.000001,0) [0|0] "" GEO
SG_ BLE_GPS_lat : 32|32@1- (0.000001,0) [0|0] "" GEO
BO_ 213 BLE_GPS_DATA_CNT: 1 BLE
SG_ BLE_GPS_COUNT : 0|8@1+ (1,0) [0|0] "" GEO,SENSOR
Messages received By Bluetooth controller:
BO_ 214 GEO_CURRENT_COORD: 8 GEO
SG_ GEO_CURRENT_COORD_LONG : 0|32@1- (0.000001,0) [0|0] "" MASTER,BLE
SG_ GEO_CURRENT_COORD_LAT : 32|32@1- (0.000001,0) [0|0] "" MASTER,BLE
BO_ 194 MASTER_TELEMETRY: 3 MASTER
SG_ MASTER_TELEMETRY_gps_mia : 0|1@1+ (1,0) [0|1] "" BLE
SG_ MASTER_TELEMETRY_sensor_mia : 1|1@1+ (1,0) [0|1] "" BLE
SG_ MASTER_TELEMETRY_sensor_heartbeat : 2|1@1+ (1,0) [0|1] "" BLE
SG_ MASTER_TELEMETRY_ble_heartbeat : 3|1@1+ (1,0) [0|1] "" BLE
SG_ MASTER_TELEMETRY_motor_heartbeat : 4|1@1+ (1,0) [0|1] "" BLE
SG_ MASTER_TELEMETRY_geo_heartbeat : 5|1@1+ (1,0) [0|1] "" BLE
SG_ MASTER_TELEMETRY_sys_status : 6|2@1+ (1,0) [0|3] "" BLE
SG_ MASTER_TELEMETRY_gps_tele_mia : 8|1@1+ (1,0) [0|1] "" BLE
BO_ 195 GEO_TELECOMPASS: 6 GEO
SG_ GEO_TELECOMPASS_compass : 0|12@1+ (0.1,0) [0|360.0] "" MASTER,BLE
SG_ GEO_TELECOMPASS_bearing_angle : 12|12@1+ (0.1,0) [0|360.0] "" MASTER,BLE
SG_ GEO_TELECOMPASS_distance : 24|12@1+ (0.1,0) [0|0] "" MASTER,BLE
SG_ GEO_TELECOMPASS_destination_reached : 36|1@1+ (1,0) [0|1] "" MASTER,BLE
SG_ GEO_TELECOMPASS_checkpoint_id : 37|8@1+ (1,0) [0|0] "" MASTER,BLE,SENSOR
BO_ 196 GEO_TELEMETRY_LOCK: 1 GEO
SG_ GEO_TELEMETRY_lock : 0|8@1+ (1,0) [0|0] "" MASTER,SENSOR,BLE
BO_ 3 SENSOR_LIDAR_OBSTACLE_INFO: 6 SENSOR
SG_ SENSOR_LIDAR_OBSTACLE_INFO_SECTOR0 : 0|4@1+ (1,0) [0|12] "" MASTER,BLE
SG_ SENSOR_LIDAR_OBSTACLE_INFO_SECTOR1 : 4|4@1+ (1,0) [0|12] "" MASTER,BLE
SG_ SENSOR_LIDAR_OBSTACLE_INFO_SECTOR2 : 8|4@1+ (1,0) [0|12] "" MASTER,BLE
SG_ SENSOR_LIDAR_OBSTACLE_INFO_SECTOR3 : 12|4@1+ (1,0) [0|12] "" MASTER,BLE
SG_ SENSOR_LIDAR_OBSTACLE_INFO_SECTOR4 : 16|4@1+ (1,0) [0|12] "" MASTER,BLE
SG_ SENSOR_LIDAR_OBSTACLE_INFO_SECTOR5 : 20|4@1+ (1,0) [0|12] "" MASTER,BLE
SG_ SENSOR_LIDAR_OBSTACLE_INFO_SECTOR6 : 24|4@1+ (1,0) [0|12] "" MASTER,BLE
SG_ SENSOR_LIDAR_OBSTACLE_INFO_SECTOR7 : 28|4@1+ (1,0) [0|12] "" MASTER,BLE
SG_ SENSOR_LIDAR_OBSTACLE_INFO_SECTOR8 : 32|4@1+ (1,0) [0|12] "" MASTER,BLE
SG_ SENSOR_LIDAR_OBSTACLE_INFO_SECTOR9 : 36|4@1+ (1,0) [0|12] "" MASTER,BLE
SG_ SENSOR_LIDAR_OBSTACLE_INFO_SECTOR10 : 40|4@1+ (1,0) [0|12] "" MASTER,BLE
SG_ SENSOR_LIDAR_OBSTACLE_INFO_SECTOR11 : 44|4@1+ (1,0) [0|12] "" MASTER,BLE
BO_ 4 GEO_TURNING_ANGLE: 2 GEO
SG_ GEO_TURNING_ANGLE_degree : 0|9@1- (1,0) [-180|180] "" MASTER,BLE
Geographical Controller
Design & Implementation
GPS and Compass Module:
GPS:
GPS is a global navigation satellite system that provides geo location and time information to a GPS receiver anywhere on or near the Earth where there is an unobstructed line of sight to four or more GPS satellites.
Compass:
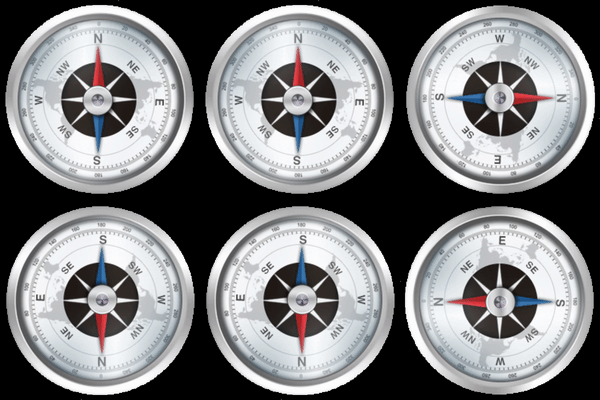
A compass is an instrument used for navigation and orientation that shows direction relative to the geographic cardinal directions (or points). Usually, a diagram called a compass rose shows the directions north, south, east, and west on the compass face as abbreviated initials. When the compass is used, the rose can be aligned with the corresponding geographic directions; for example, the "N" mark on the rose really points northward. Compasses often display markings for angles in degrees in addition to (or sometimes instead of) the rose. North corresponds to 0°, and the angles increase clockwise, so east is 90° degrees, south is 180°, and west is 270°. These numbers allow the compass to show azimuths or bearings, which are commonly stated in this notation.
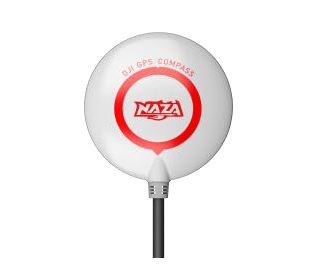
We are using DJI’s NAZA GPS/COMPASS to get the GPS coordinates and Heading angle. The diagram of the module is as follows:
Advantages of DJI NAZA GPS:
Message Structure:
GPS:
The 0x10 message contains GPS data. The message structure is as follows:
The payload is XORed with a mask that changes over time. Values in the message are stored in little endian.
HEADER
BYTE 1-2: message header - always 55 AA
BYTE 3: message id (0x10 for GPS message)
BYTE 4: length of the payload (0x3A or 58 decimal for 0x10 message)
PAYLOAD
BYTE 5-8 (DT): date and time
BYTE 9-12 (LO): longitude (x10^7, degree decimal)
BYTE 13-16 (LA): latitude (x10^7, degree decimal)
CHECKSUM
BYTE 63-64 (CS): checksum
XOR mask
All bytes of the payload except 53rd (NS), 54th, 61st (SN LSB) and 62nd (SN MSB) are XORed with a mask. Mask is calculated based on the value of byte 53rd (NS) and 61st (SN LSB).
Compass:
The 0x20 message contains compass data. The structure of the message is as follows:
Values in the message are stored in little endian format.
HEADER
BYTE 1-2: message header - always 55 AA
BYTE 3 : message id (0x20 for compass message)
BYTE 4 : length of the payload (0x06 or 6 decimal for 0x20 message)
PAYLOAD
BYTE 5-6 (CX): compass X axis data (signed)
BYTE 7-8 (CY): compass Y axis data (signed)
BYTE 9-10 (CZ): compass Z axis data (signed)
XOR
All the bytes of the payload except 9th are XORed with a mask. Mask is calculated based on the value of the 9th byte.
If we index bits from LSB to MSB as 0-7 we have:
mask[0] = 9thByte[0] xor 9thByte[4]
mask[1] = 9thByte[1] xor 9thByte[5]
mask[2] = 9thByte[2] xor 9thByte[6]
mask[3] = 9thByte[3] xor 9thByte[7] xor 9thByte[0];
mask[4] = 9thByte[1];
mask[5] = 9thByte[2];
mask[6] = 9thByte[3];
mask[7] = 9thByte[4] xor 9thByte[0];
Calibration:
Why calibrate the compass?
Ferromagnetic substances placed on multi-rotor or around its working environment affect the reading of earth’s magnetic field for the digital compass. It also reduces the accuracy of the multi-rotor control, or even reads an incorrect heading. Calibration will eliminate such influences, and ensure MC system performs well in a non-ideal magnetic environment.
When to do it?
• The first time you install Naza compass.
• When the multi-rotor mechanical setup has changed.
• If the GPS/Compass module is re-positioned.
• If electronic devices are added/removed/re-positioned.
Pin Configuration:
The Pin Configuration is as follows:
Software Design
Flow Chart:
Algorithm:
Distance calculation:
We are using the ‘haversine’ formula to calculate the great-circle distance between two points – that is, the shortest distance over the earth’s surface
Haversine formula:
a = sin²(Δφ/2) + cos φ1 ⋅ cos φ2 ⋅ sin²(Δλ/2) c = 2 ⋅ atan2( √a, √(1−a) ) d = R ⋅ c
where φ is latitude, λ is longitude, R is earth’s radius (mean radius = 6,371km)
Bearing Angle calculation:
The bearing of a point is the number of degrees in the angle measured in a clockwise direction from the north line to the line joining the centre of the compass with the point. A bearing is used to represent the direction of one point relative to another point. The bearing angle is calculated by using the following formula:
Formula:
θ = atan2( sin Δλ ⋅ cos φ2 , cos φ1 ⋅ sin φ2 − sin φ1 ⋅ cos φ2 ⋅ cos Δλ )
where φ1,λ1 is the start point, φ2,λ2 the end point (Δλ is the difference in longitude)
Since atan2 returns values in the range –π to +π (that is, -180° to +180°), to normalize the result to a compass bearing (in the range 0° to 360°), negative values are transformed into the range 180° to 360°) by converting to degrees first and then using (θ+360) % 360, where % is (floating point) modulo.
DBC Messages:
Implementation
Testing & Technical Challenges
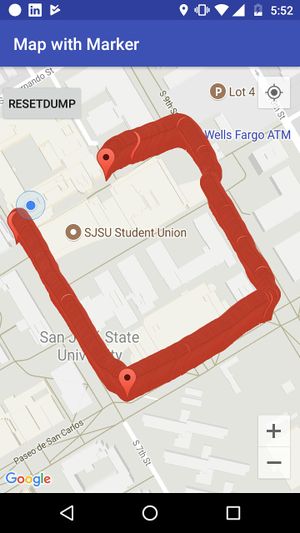
Initially, when we started testing, the car was going to the edges even if the path was towards the middle of the road as per google maps. So after developing an app to map the checkpoints we found that the path is actually inside the buildings. So, we had to find a different solution to solve this problem. Afterwards, we created a database of all the routes in campus and then processed the route through the android app.
PCB Design
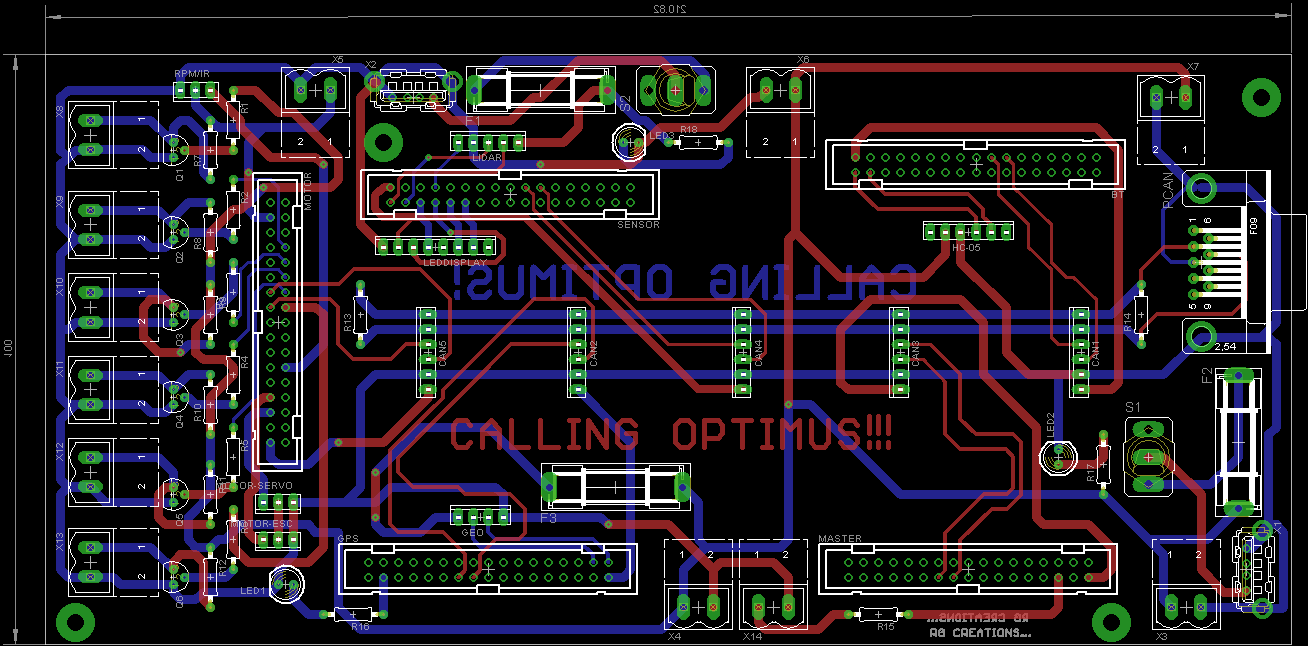
Git Project Management
Common Technical Challenges
Project Videos
Conclusion
Project Source Code
References
Acknowledgement
== References Used ==
