Difference between revisions of "S18: Traffic Menace Video Game"
Proj user11 (talk | contribs) (→Game Algorithm) |
Proj user11 (talk | contribs) (→Hardware Interface Diagram) |
||
| Line 399: | Line 399: | ||
==== Hardware Interface Diagram ==== | ==== Hardware Interface Diagram ==== | ||
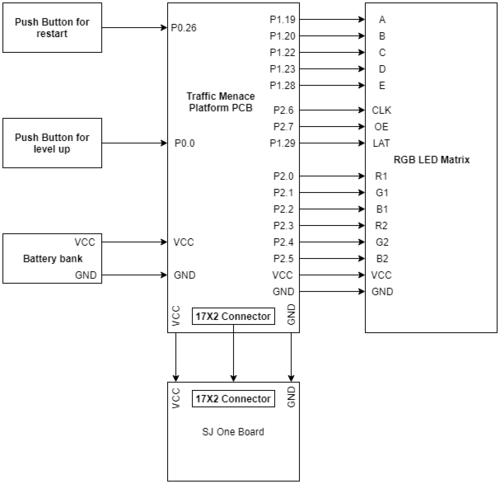
The below diagram shows the pins connection of SJOne board with PCB and the push buttons. It shows the pins used by the SJOne board to connect to LED. It also shows the master switch for disconnecting the power supply. | The below diagram shows the pins connection of SJOne board with PCB and the push buttons. It shows the pins used by the SJOne board to connect to LED. It also shows the master switch for disconnecting the power supply. | ||
| + | |||
| + | [[File:CMPE244_S18_Hardwareinfacediagram.png|500px|thumb|center|Hardware Interface Diagram]] | ||
=== Software Design === | === Software Design === | ||
Revision as of 22:02, 25 May 2018
Contents
Traffic Menace
Abstract
The project focuses on developing a game on a 64*64 RGB LED. The game is all about controlling a car on a road having traffic. The LED would be displaying a user-controlled car and road with many different cars on it. The user needs to tilt the LED screen to avoid traffic and safely drive the car. An accelerometer is used to detect the tilt of the LED screen and move the car accordingly. As the level increases, the car speed and frequency of traffic would increase. The user starts the game with 3 lives. Any collision with oncoming traffic results in losing one life, and the game ends after losing all 3 lives. A switch is provided in case the player wants to restart the game anytime. User lives and score are displayed on the LED.
Objectives & Introduction
Our primary goal of this project is to write drivers for the LED and develop a game with FreeRTOS. The position of the car is controlled by the accelerometer. We use the onboard accelerometer in the SJ one board which is connected via I2C. Random traffic is generated at random speed. The speed of the traffic also increases as the level increases. The level can be manually increased by pressing the push button which gives user less time to react. When the game ends after loosing all 3 lives it can restarted by pressing the push button.
The objectives are as follows:
- Write drivers to control pixels in LED.
- Implement algorithm for controlling car.
- Implement algorithms for Traffic and Obstacles.
- Continuously update the position of car and traffic.
- Continuously update scores.
Team Members & Responsibilities
- Danny Santoso
- Hardware and PCB Design
- Dheemanth Bangalore Vishwanatha
- LED Display Driver
- Integrating Display code to Accelerometer
- Game Algorithm Development
- Monica Parmanand
- UI Design and Animations
- Pratap Kishore Desai
- LED Display Driver
- Game Algorithm Development
- Pratap Ramachandran
- Game Algorithm Development
- Testing
Schedule
| Week# | Start Date | End Date | Task | Status | Completion Date |
|---|---|---|---|---|---|
| 1 | 4/1/18 | 4/8/18 |
|
Completed | 4/07/18 |
| 2 | 4/8/18 | 4/15/18 |
|
Completed | 4/22/18 |
| 3 | 4/15/18 | 4/24/18 |
|
Completed | 4/24/18 |
| 4 | 4/24/18 | 5/1/18 |
|
Completed | 4/29/18 |
| 5 | 5/8/18 | 5/15/18 |
|
Completed | 5/12/18 |
| 6 | 5/15/18 | 5/22/18 |
|
Completed | 5/20/18 |
Parts List & Cost
| S.No | Part Name | Cost in $ | Qty | Comments |
|---|---|---|---|---|
| 1 | SJone Board | 80 | 1 | LED controller |
| 2 | 64 x 64 LED Display | 81 | 1 | LED Display from Adafruit |
| 3 | PCB | 30 | 1 | Interfacing Display to SJ One and Power Circuitry |
| 4 | Battery bank | 30 | 1 | Power supply |
| 5 | Multimeter | 10 | 1 | For checking PCB connectivity |
| 6 | Jumper Wires | 5 | 20 | Connections |
Design & Implementation
Hardware Design
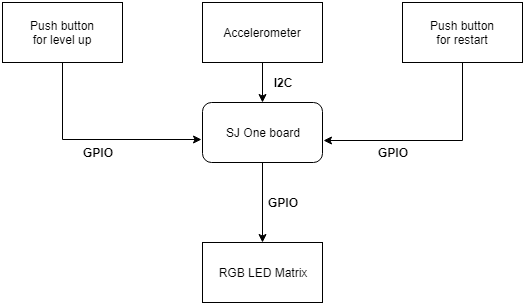
The system block diagram shows the design of our project with the interface for the sensors
Accelerometer sensor
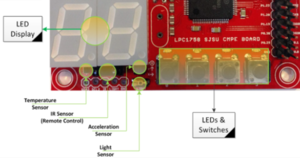
An accelerometer is an electromechanical device used to measure acceleration forces. Forces may be static, like the continuous force of gravity. Accelerometers are used to detect the orientation of the phone. The gyroscope adds an additional dimension to the information supplied by the accelerometer by tracking rotation or twist. SJOne board has an on-board accelerometer which is interfaced through I2C. Based on these values we can control the steering of the car.
Push Button
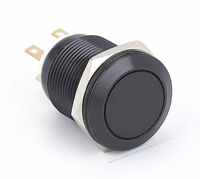
Push Button are interfaced with the SJOne board via GPIO pins which are interrupt capable. Two push button's are used for restarting and for boost. Once the player looses all 3 lives the player can restart the game with push button. The player can use the other push button for using boost.
RGB LED Matrix
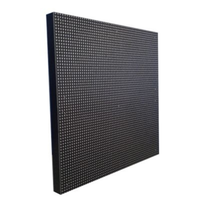
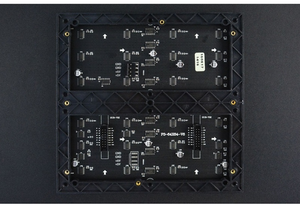
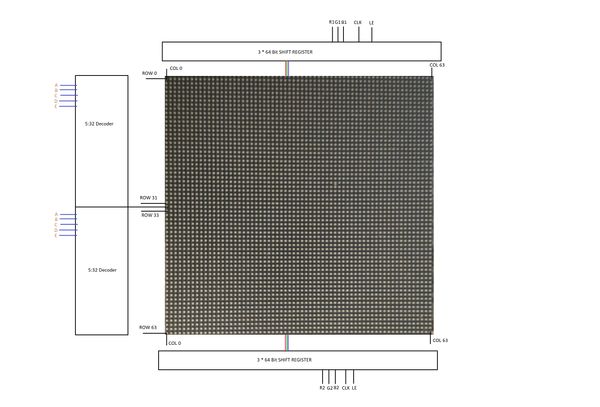
A 64x64 RGB LED Matrix Panel is used as a display. It has 4096 full-color RGB LEDs. Each LED can be independently addressed and controlled. It requires at 13 digital GPIOs to control the LED matrix. The led matrix has 2 IDC connectors DATA_IN and DATA_OUT on the back, we can cascade multiple panels and make a huge screen together. The LED display is constructed using a decoder to decode address rows. A 64 bit Shift register should be clocked for enabling the colour. The RGB matrix has a 5:32 decoder. This decoder takes ABCDE as input and decodes the corresponding row to be kept low. Now when the row is low we need to select which all pixels in the column is to be configured with the required colour. This is done by clocking the 64Bit shift register. There are 6 64Bit registers each for R1 R2 B1 B2 G1 G2. A single clock is interfaced to all these 6 64bit shift registers. So at once we shift and fill the required colour for the column display. R1 G1 B1 is used for configuring colour for the top half of the display and R2 G2 B2 for bottom half of the display. Once the clocking and shifting the register is completed we need to latch this data to the register. The register data is sent out to all the row lines and that Row line which is pulled low by the decoder will receive this data and corresponding pixels are turned on.
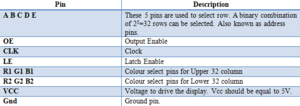
RGB LED matrix pins:
| S.NO | RGB LED pins | Function |
|---|---|---|
| 1 | R1 | High R data |
| 2 | G1 | High G data |
| 3 | B1 | High B data |
| 4 | R2 | Low R data |
| 5 | G2 | Low G data |
| 6 | B2 | Low B data |
| 7 | A | Row select A |
| 8 | B | Row select B |
| 9 | C | Row select C |
| 10 | D | Row select D |
| 11 | E | Row select E |
| 12 | CLK | Clock signal. |
| 13 | OE | Output enables to cascade LED panel. |
| 14 | LAT | Latch denotes the end of data. |
RGB LED matrix power pins:
| S.NO | RGB LED power pins | Function |
|---|---|---|
| 1 | VCC | 5V |
| 2 | VCC | 5V |
| 3 | GND | GND |
| 4 | GND | GND |
Pin description:
The LED display has 16 pins. The table below details the pins and its purpose.
Specifications:
The LED display used in our project is a 64*64 pixel panel with a pixel pitch of 3mm. More specifications are tabulated.
- Operating voltage: DC 5V
- Average power consumption: <500W/㎡
- Maxim Power Consumption: <1000w/㎡
- Pixel: 64x64=4096
- Level of viewing Angle: ≧160°
- Control mode: Synchronous control
- Drive mode: 1/16 scan rate
- Repetition frequency: ≧60Hz
- White Balance Brightness: ≧1200cd/㎡
- Refresh frequency : ≧300Hz
- MTTF: ≧5000 hours
- Service Life: 75000~100000 hours
- Pixel pitch: 3mm
- Thickness: 11mm
Printed Circuit Board
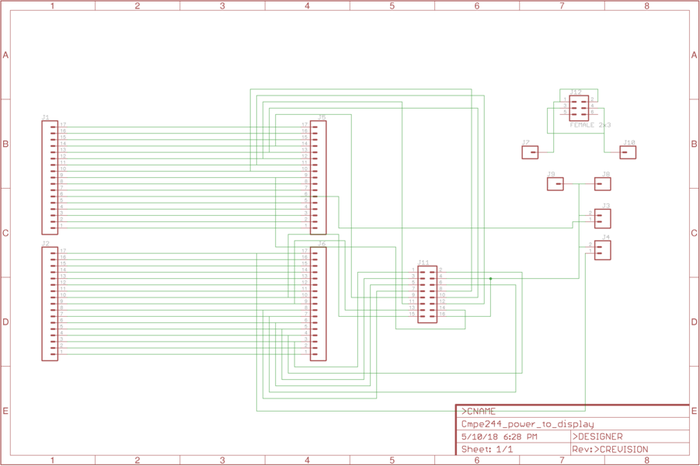
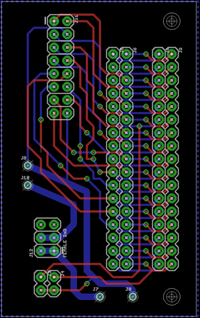
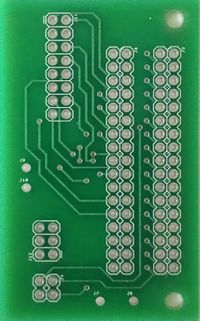
The PCB layout was designed using free version of Eagle v8.7.1. We imported and used sparkfun libraries. We used the through hole schematic connections for the PCB design. We designed a 2 layer PCB. The LED is powered by a 5V battery bank which is connected via the PCB. SJ-One Board is also powered by the PCB. And a master switch to turn off the power supply along with 2x17 SJ-One Board connector. All connections are verified properly with Design Rule Check before printing.
EAGLE Schematic
EAGLE Connector List
| S.No | Section | Connector |
|---|---|---|
| 1 | Power Connector | 2x2-pin |
| 2 | SJ-One Board | 2x17-pin |
| 3 | LCD Section | 1x9-pin |
| 4 | Switch | SPST |
After the schematics are created the parts are placed in locations such that it is easy for mounting on top of the SJ-One Board. Before soldering the components on the PCB the connectivity of the PCB is checked using a multimeter.
3D Printing Design
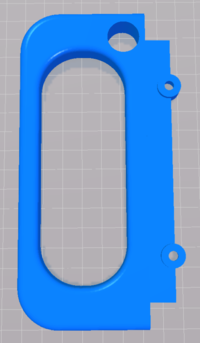
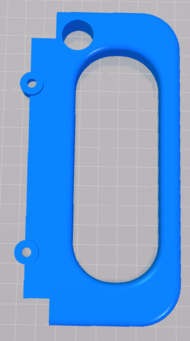
This is one of the important parts of the project. Since we wanted to make it more compact we mounted our SJ One Board, PCB and power bank behind the LED. When the player wants to use it he needs to hold the edges of the LED this will reduce the visibility of the user. So, we designed and 3D Printed a handle for the LED which makes it easier to hold the LED. The files were taken from Adafruit website and these handles were designed specifically for their displays which caused mounting issues with our displays. So instead of screwing them, we ended up gluing the handles to display
Hardware Interface Diagram
The below diagram shows the pins connection of SJOne board with PCB and the push buttons. It shows the pins used by the SJOne board to connect to LED. It also shows the master switch for disconnecting the power supply.
Software Design
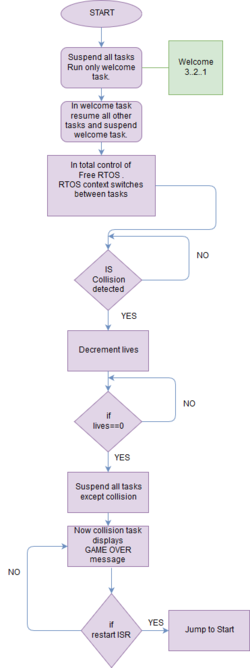
To design the software we have made use of a singleton class pattern for LED driver and a number of tasks that Free RTOS will handle. Which task is to be running at an instance should be decided. The priority for each task to run is important to have a good user experience.
Implementation
The software design can be mainly split into 2 parts
• The driver for LED
• The game algorithm
Driver For LED
To design the driver for the LED Display it is required to have a clear-cut understanding of working LED. So it is recommended to read the hardware part before trying to understand the driver.
The SJone board is interfaced to the LED using 14 GPIO pins. All these pins are set as output. Except OE all other pins are initialised low. OE is set high as it is active low.The display driver makes use of a buffer which stores the color code to be set at perticular pixel on the display. Whenever a pixel is to be lighten up the corresponding color to be lighten up will be stored in the buffer. The size of the buffer is 2048. For the first and thirty third row the buffer[0] to buffer [63] is made use. For second thirty fourth buffer [64] to buffer [127] is used and so on. Each element of buffer is 1 byte and each bit that is from bit 2 to bit 8 has the value of R1 G1 B1 R2 G2 B2. If once a colour is set for a particular pixel then the buffer will be updated and when the pixel is to be turned off then the buffer should be cleared. A timer interrupt is used to update the display ones in 0. 9ms. When an interrupt occurs 2 rows are updated. Once the full display is written the row is set back to initial value and the same process continues. The time interval for updating the display is so fast that the human eye would believe to see motion.
Game Algorithm
The main objective of the game algorithm is to provide the player with randomized gameplay. No part of the gameplay should be predictable.
Lanes
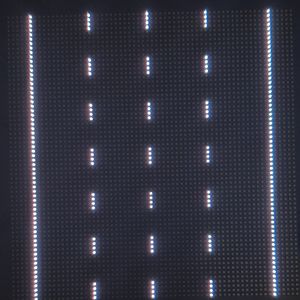
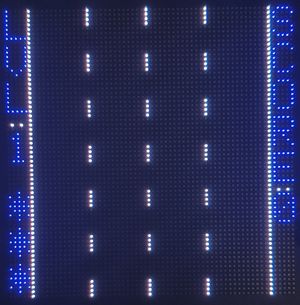
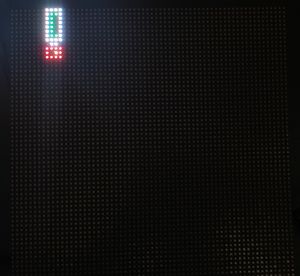
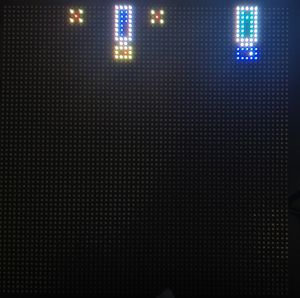
We began by creating a 4-lane road on the display as shown below. Each lane would contain one vehicle at any given time. Current Level would be displayed at the left of the display along with lives remaining and the current score at the right
Vehicle types
We then began by creating different types of vehicles, which varied by size, shape, and colors. To create a vehicle, we used a lookup table for each vehicle which contained the color values in hex for each pixel that would make up the vehicle. Using draw pixel within customized for-loops, vehicles were rendered.
//Syntax for Drawing a Truck

uint16_t truckc[12][4] =
{

        0xFFFF,0xFFFF,0xFFFF,0xFFFF,
        0xFFFF,0x0780,0x0780,0xFFFF,
        0xFFFF,0x0780,0,0xFFFF,
        0xFFFF,0x0780,0,0xFFFF,
        0xFFFF,0x0780,0,0xFFFF,
        0xFFFF,0x0780,0,0xFFFF,
        0xFFFF,0x0780,0x0780,0xFFFF,
        0xFFFF,0xFFFF,0xFFFF,0xFFFF,
        0,0xFFFF,0xFFFF,0,
        0xF000, 0xF000,0xF000,0xF000,
        0xF000 ,0,0xf780,0xF000,
        0xF000,0xF000,0xF000,0xF000
};

vehicle_type = &truckc[0][0];

//Draw Vehicle
for(int i = 0 ; i<vehicle_length ; i++)
    {

        for(int j = 0 ; j <vehicle_width ; j++)
        {
            Traffic.drawPixel(j+offset,position+i,vehicle_type[j]);
            collision[j+offset][position+i]|=1;
        }
        vehicle_type=vehicle_type+vehicle_width;
    }

//Clear Vehicle
 for(int j = 0 ; j < vehicle_width ; j++)
    {
        for(int s=0 ; s<speed ; s++)
        {
            Traffic.drawPixel(j+offset,position+s,0);
            collision[j+offset][position+s]=0;
        }

    }
Traffic level
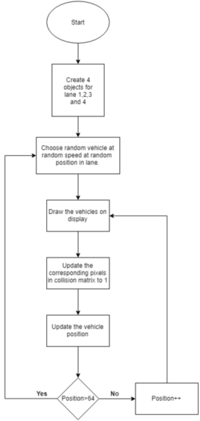
The traffic class contained functions to randomize the vehicle selection, speed and location of each vehicle within a lane. The speed of the oncoming traffic increased with the change in levels. Initially, the speed was restricted between 1 – 3. As levels progressed this range was increased 2-5, 3-6 and so on. The scoring system was directly related to level. Initial levels meant the increment in scores was slow and as levels progressed the increment gradually increased. The position of the used car is at the bottom of the display during earlier levels and this position gradually increases to the middle of the display in later stages
Collision
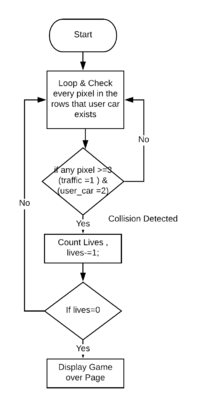
The collision was detected using a 64x64 matrix which replicated the actual display canvas. Each traffic vehicle updated its corresponding position with '1' in the matrix and the user vehicle updated its position with 2. When there was an overlap of two vehicles their values added up. This added up value determined collision. The collision was detected using for loop for the entire rows in which user car existed. So around 60 x 3 pixels were constantly monitored for collision. To reduce task CPU consumption we added minor delays so the task yields, this reduced CPU consumption without affecting its performance
User Car Task
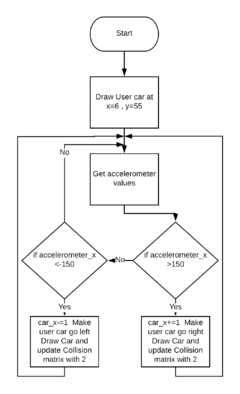
The user car task is mainly the way a user can interact with the game. The user will tilt the display left or right to control the car. The car movement is controlled by calibrating the on board accelerometer. The accelerometer values are well tested and verified to give a better user experience while playing with the display. The user task works in conjunction with police_task to animate the car to appear like a police car.
Restart
In-order improve game-play experience each player is provided with 3 lives after which the game ends. A game restart button was added to restart the game. This button only works when the player loses all 3 lives.
Level Up button
The Level Up button to the left makes the user to play the game a level ahead. This would reduce the distance to the upcoming traffic and also increase the score. This can also be used to jump small vehicles to avoid oncoming traffic.
Testing & Technical Challenges
Testing
Testing is an important part of the development of a project. The hardware setup after integrating Display, Sjone board, PCB and push button was tested using a multimeter.
• The accelerometer tilt was tested frequently and the movement of the car was updated accordingly. This is very important as a user will interact with the game by tilting the board.
• There are a number of tasks which are always running to keep the game alive all these tasks where separately tested and were also tested after integration.
• The testing team also analyzed the CPU usage by individual tasks and raised issues whenever a task was overhead for the CPU.
Technical Challenges
LED Display working
The LED display we used did not have a data sheet. We had to understand the working by going through an example project of Arduino interfaced to the LED display. None of us had a prior experience working with LED so it was difficult and challenging to explore new things.
Collision Detection
The collision detection of 2 cars was challenging. Initially, we started by detecting a collision on a single row. This idea was extended to multiple rows. The CPU usage was extremely high when the task to detect collision was run continuously without any delay. The consumption of CPU was around 30%. So definitely not a good way to detect collision but still looping was necessary to detect a collision in a row. It is then we came up with an idea where in we just delayed our collision detection such that no collision would escape and also the CPU usage was decreased.
Setting up all the hardware
Mounting all the hardware on the back of the display was challenging. There were very few mounting points and a lot of hardware to mount. We had to mount sj one board with PCB and all the wiring and also the power bank in such a way that it will not fall out or damage the display.
Conclusion
Conclude your project here. You can recap your testing and problems. You should address the "so what" part here to indicate what you ultimately learnt from this project. How has this project increased your knowledge?
Project Video
Upload a video of your project and post the link here.
Project Source Code
References
Acknowledgement
We would like to thank our Professor Preetpal Kang for all his teachings and inspirational lectures. This project has been an overall learning experience and precious life lessons. We would also like to thank the ISA members for always being ready to help with whatever issues we faced.
References Used
[1] FreeRTOS documentations
[2] Dfrobot 64x64 RGB LED Matrix
[3] DFRobot library
[4] FreeRTOS API
[5] CMPE 244 Lecture notes from Preetpal Kang, Computer Engineering, San Jose State University. Jan-May 2018.
