Difference between revisions of "S15: Patient Buddy System (PBS)"
Proj user7 (talk | contribs) (→3. Patient Orientation:) |
Proj user7 (talk | contribs) (→ALGORITHMS:) |
||
| Line 159: | Line 159: | ||
=====ALGORITHMS:===== | =====ALGORITHMS:===== | ||
| + | |||
=====1. Heart Rate calculation:===== | =====1. Heart Rate calculation:===== | ||
*The heart rate (bpm) is calculated by sensing the photoplethysmograph signal from the Pulse Sensor. By using the adc0_get_reading() function, we are able to read the analog signal from the sensor. Since the analog signal we were getting was noisy, we used a standard median filter with window size of 3 to eliminate the noise. By comparing the current data with that of the past data and the future data, we are able to find the peak of the signal. By calculating the average time space between the 10 consecutive peaks, inter-beat interval (IBI), we are able to calculate the heart rate. | *The heart rate (bpm) is calculated by sensing the photoplethysmograph signal from the Pulse Sensor. By using the adc0_get_reading() function, we are able to read the analog signal from the sensor. Since the analog signal we were getting was noisy, we used a standard median filter with window size of 3 to eliminate the noise. By comparing the current data with that of the past data and the future data, we are able to find the peak of the signal. By calculating the average time space between the 10 consecutive peaks, inter-beat interval (IBI), we are able to calculate the heart rate. | ||
Revision as of 00:58, 25 May 2015
Contents
Grading Criteria
- How well is Software & Hardware Design described?
- How well can this report be used to reproduce this project?
- Code Quality
- Overall Report Quality:
- Software Block Diagrams
- Hardware Block Diagrams
- Schematic Quality
- Quality of technical challenges and solutions adopted.
Patient Buddy System
Abstract
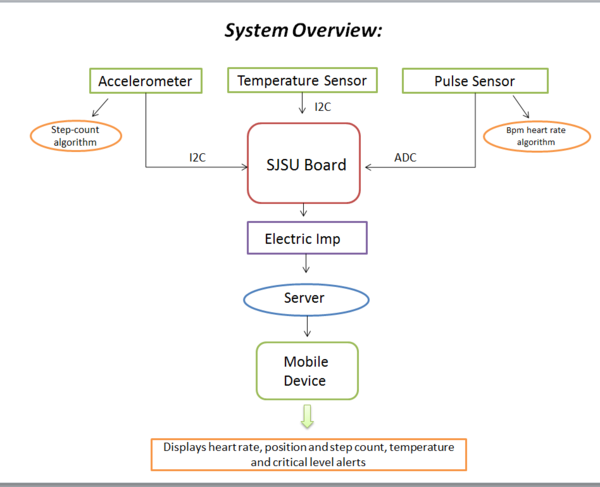
A system to enable the doctor or caregivers to remotely detect the physiologic measurements of multiple patients and receive alerts if patients’ conditions get critical or if the patient seeks emergency help. The system measures heartbeat, body temperature, position (sleeping or standing) and activity of the day (step count) continuously. The doctor or caregiver can monitor these measurements and receive alerts in their mobile app.
Objectives & Introduction
- Monitor physiologic measurements of the patients: heartbeat, temperature, patient position: sleeping or standing, patient activity: step count
- Allows the doctor/caregiver to monitor physiologic data for multiple patients.
- Determine if the patient’s physiological conditions are critical.
- Automatically alert the doctor/caregiver of the patient’s conditions if critical conditions are reached.
- Allow the patient to request for emergency help.
Team Members & Responsibilities
- Avinash Closepet Suresh
- Orientation algorithm development and implementation
- Girish Bangalore Ramesh
- Board to server communication implementation
- Thiruparan Balachandran
- Step count algorithm development, implementation and system integration
- Nimmi Bhatt
- Heart rate algorithm and implementation
- All of us:
- Collectively worked on end to end system testing and integrating data into an android app
Schedule
| Week# | Date | Task | Actual |
|---|---|---|---|
| 1 | 4/14/2015 | Order materials, ElectricImp exploration, Patient Position | Completed ordering materials |
| 2 | 4/21/2015 | Develop position details about the subject's orientation via the accelerometer, test different algorithm methods and store the data in Flash. | Completed getting the position details and developing a basic algorithm; Attempts to modify the algorithm are in progress. |
| 3 | 4/28/2015 | End to End Communication: Getting the data from the sensor and displaying it on the app's page. | Completed sending data via electric imp and reading it on the server on other side. |
| 4 | 5/05/2015 | Add other sensors to the system (temperature and heart rate) and work on doctor to patient communication and implement some emergency feature. | Completed integrating the heart rate sensor. The ADC collects the raw heart rate and runs the data through a heart rate algorithm. The algorithm will measure critical levels. |
| 5 | 5/12/2015 | Improve app and work on data analysis on the app's side to make the data look meaningful and interesting. | Completed heart rate algorithm and implemented DSP to get a cleaner heart rate. Completed processing accelerometer data to determine the footsteps and orientation. |
| 6 | 5/19/2015 | Improve and implement the android app and test the entire system from end to end. | Planned |
| 7 | 5/22/2015 | Demo! | Planned |
Parts List & Cost
| Item# | Part | Vendor | Vendor P/N | Cost | Link |
|---|---|---|---|---|---|
| 1 | SJ One Board | Preet | n/a | 79.99$ | http://www.socialledge.com/sjsu/index.php?title=SJ_One_Board |
| 2 | Pulse Sensor | Sparkfun | SEN-11574 | 24.95$ | https://www.sparkfun.com/products/11574 |
| 3 | Electric Imp | Sparkfun | WRL-11395 | 29.95$ | https://www.sparkfun.com/products/11395 |
| 4 | Electric Imp Breakout Board | Sparkfun | BoB-12886 | 12.95$ | https://www.sparkfun.com/products/12886 |
| 5 | Temperature Sensor-TMP102 | Sparkfun | SEN-11931 | 05.95$ | https://www.sparkfun.com/products/11931 |
- Total Cost: 153.79$
Design & Implementation
Hardware Design
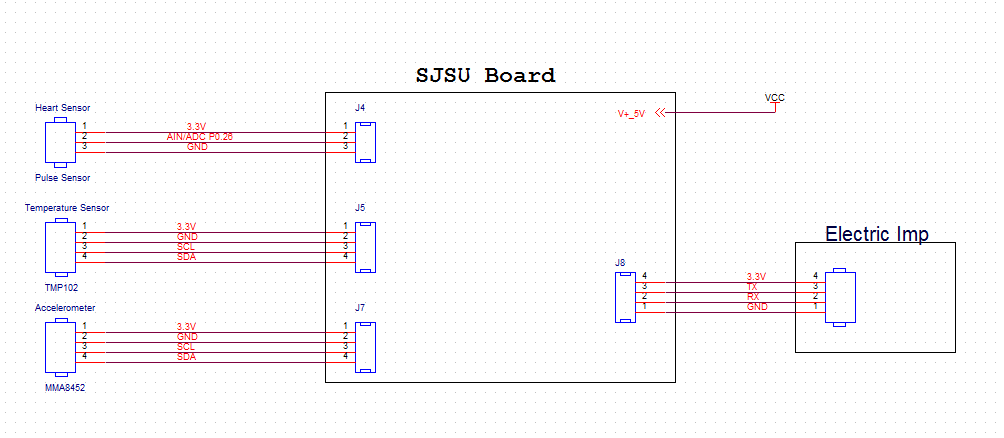
Discuss your hardware design here. Show detailed schematics, and the interface here.
Hardware Interface
In this section, you can describe how your hardware communicates, such as which BUSes used. You can discuss your driver implementation here, such that the Software Design section is isolated to talk about high level workings rather than inner working of your project.
- Pulse sensor:
- Sends the raw photoplethysmograph signal to the on-board ADC and the signal is sampled every 2ms.
- Accelerometer sensor:
- On-board accelerometer sensor is interfaced via the I2C bus to get the 3-A acceleration.
- Temperature sensor:
- External temperature sensor, TMP102, is interfaced via the I2C bus to get on-body temperature readings.
- Electric Imp:
- Collected data is sent to the server via Electric Imp. UART bus is used for communication between the board and Electric Imp.
Software Design
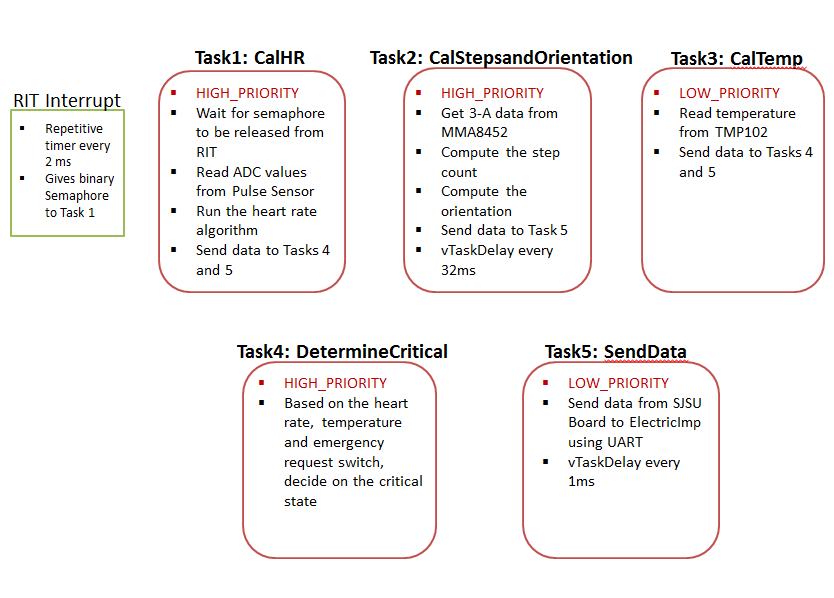
Show your software design. For example, if you are designing an MP3 Player, show the tasks that you are using, and what they are doing at a high level. Do not show the details of the code. For example, do not show exact code, but you may show psuedocode and fragments of code. Keep in mind that you are showing DESIGN of your software, not the inner workings of it.
- Firmware of the SJ One Board is designed using FreeRTOS. C++ language is used to write the firmware. The drivers provided by the SJ One Board manufacturer are used for low level application. Each task is assigned to collect a measurement, process an algorithm on it and compute the result. To maintain the high accuracy sampling frequency of the pulse sensor, the RIT- repetitive timers, interrupt service routine and binary semaphore are used. To maintain the sampling frequency of the accelerometer and the temperature sensor vTaskDelay is used. Since the clock cycles spent on the tasks are low, using the vTaskDelay was accurate enough to get a reasonably constant sampling frequency of the accelerometer and the temperature sensors.
ALGORITHMS:
1. Heart Rate calculation:
- The heart rate (bpm) is calculated by sensing the photoplethysmograph signal from the Pulse Sensor. By using the adc0_get_reading() function, we are able to read the analog signal from the sensor. Since the analog signal we were getting was noisy, we used a standard median filter with window size of 3 to eliminate the noise. By comparing the current data with that of the past data and the future data, we are able to find the peak of the signal. By calculating the average time space between the 10 consecutive peaks, inter-beat interval (IBI), we are able to calculate the heart rate.
- Algorithm Pseudocode:
- last peak time = current time //To find the first peak of the signal
- current peak time = current time //To find the second peak
- Interval = last peak time- current peak time.
- If interval is < (Inter Beat Interval *(3/5) ) // ignore it- this helps to eliminate the dichrotic notch
- //Calculate the average of ten intervals
- Heart rate = 1min/ interval
2. Step Count Algorithm:
- The step count is calculated using the on-board accelerometer. Initial threshold for the step count is calculated based on the R&D, as mentioned in the implementation part.
- Pseudocode:
- Initialize the dynamic Threshold based on research value
- energy = sqrt(x*x + y*y + z*z) //Calculate the energy
- Find the peak and the trough
- if((amp > dynamic threshold)&&(current_time-last_step_time > 0.4s)) {step_count++} //Calculate the amplitude
- NOTE: 0.4 sec was calculated based on the following research paper, which states that on average a human being can walk up to 150 steps per min. Source: http://www.computer.org/csdl/proceedings/icisa/2013/0602/00/06579332.pdf
- Calculate the harmonic average of the past 5 amplitudes
- Update the dynamic threshold = harmonic average*0.5
3. Patient Orientation:
- Pseudocode:
- Read the z acceleration
- If z>700 for 10sec, then patient position = lying down
- If z<700 for 10sec, then patient position = standing.
4. Critical Conditions:
- Determine if the heart rate is critical
- Determine if temperature is normal range
- Determine if emergency is requested by the patient
Implementation
This section includes implementation, but again, not the details, just the high level. For example, you can list the steps it takes to communicate over a sensor, or the steps needed to write a page of memory onto SPI Flash. You can include sub-sections for each of your component implementation.
Testing & Technical Challenges
Describe the challenges of your project. What advise would you give yourself or someone else if your project can be started from scratch again? Make a smooth transition to testing section and described what it took to test your project.
Include sub-sections that list out a problem and solution, such as:
My Issue #1
Discuss the issue and resolution.
- Analyzing sensor data:
- Issue 1: We had difficulty interpreting data. When we first collected data, we noticed some numbers change, but we didn't know how to make sense of the data. To fix this issue, we plotted the data in Matlab and ran it through some filters (such as LPF to remove noise from motion artifact) and then extracted the values from the processed data to see if they gave meaningful results. Once the data looked meaningful, we implemented those algorithms in C.
- Issue 2: IoT Device: We faced connectivity issues with using Electric Imp. The electric imp would not always work reliable on different Wifi locations.
Conclusion
Conclude your project here. You can recap your testing and problems. You should address the "so what" part here to indicate what you ultimately learnt from this project. How has this project increased your knowledge?
Project Video
Upload a video of your project and post the link here.
Project Source Code
References
Acknowledgement
Any acknowledgement that you may wish to provide can be included here.
References Used
List any references used in project.
Appendix
You can list the references you used.


