Difference between revisions of "F16: Titans"
Proj user12 (talk | contribs) (→RPM Sensor) |
Proj user12 (talk | contribs) (→Track Progress in KanBan) |
||
| (90 intermediate revisions by the same user not shown) | |||
| Line 31: | Line 31: | ||
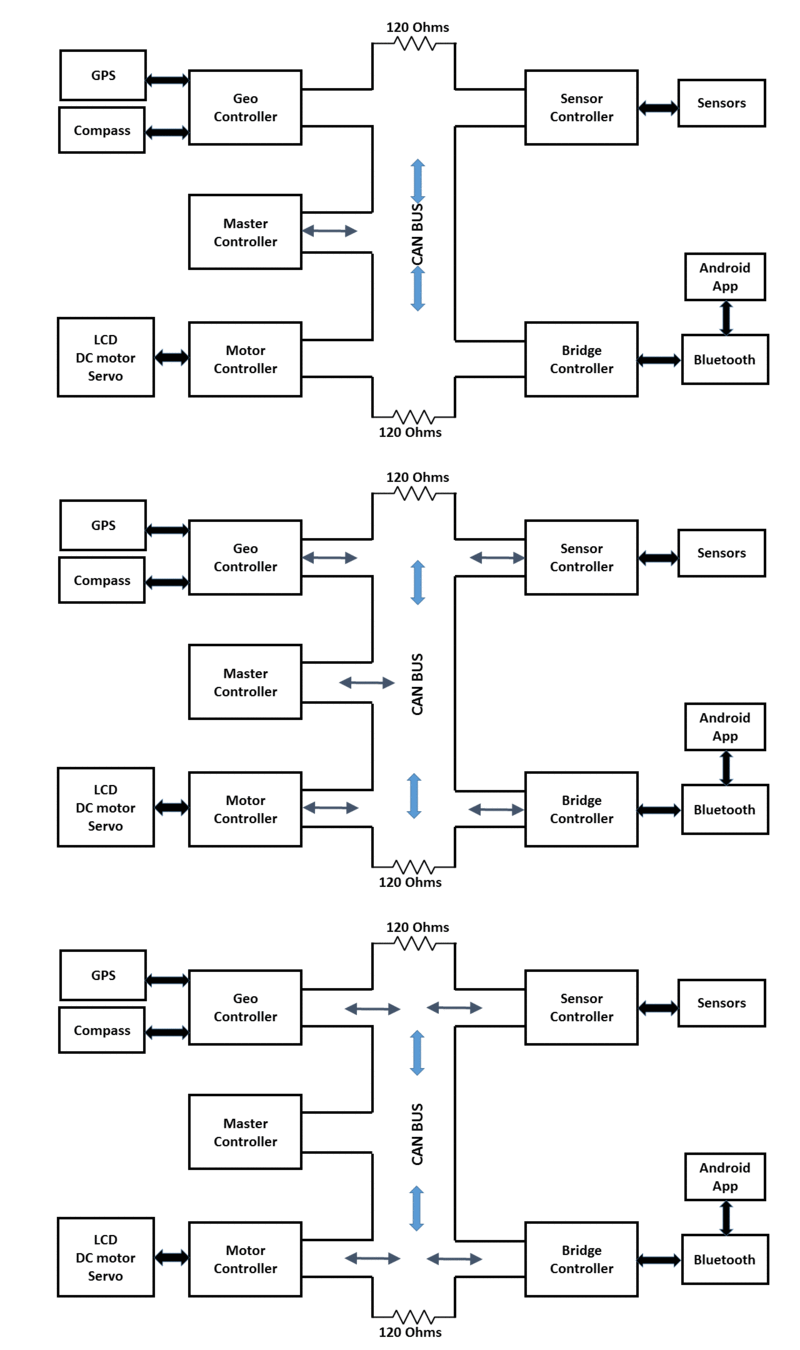
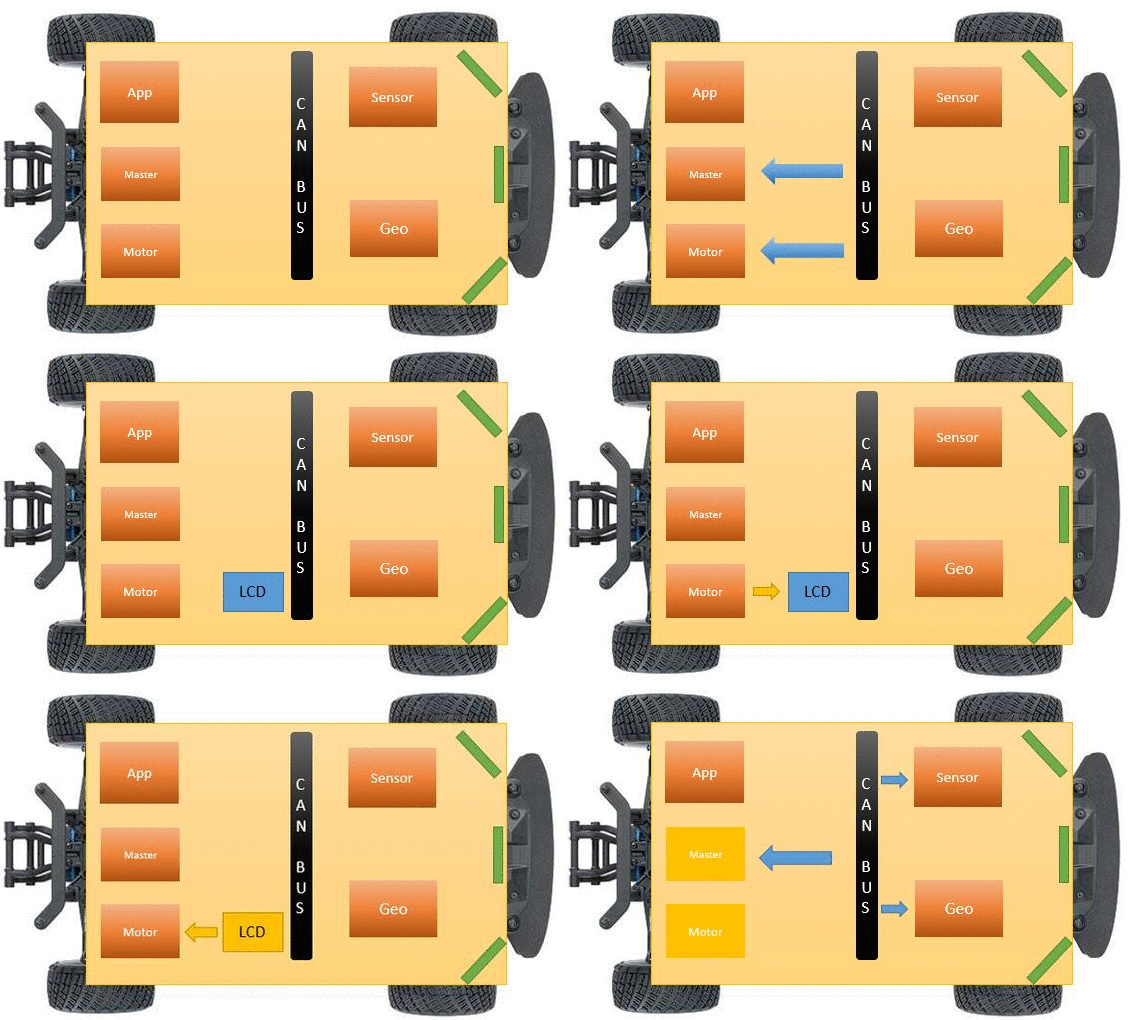
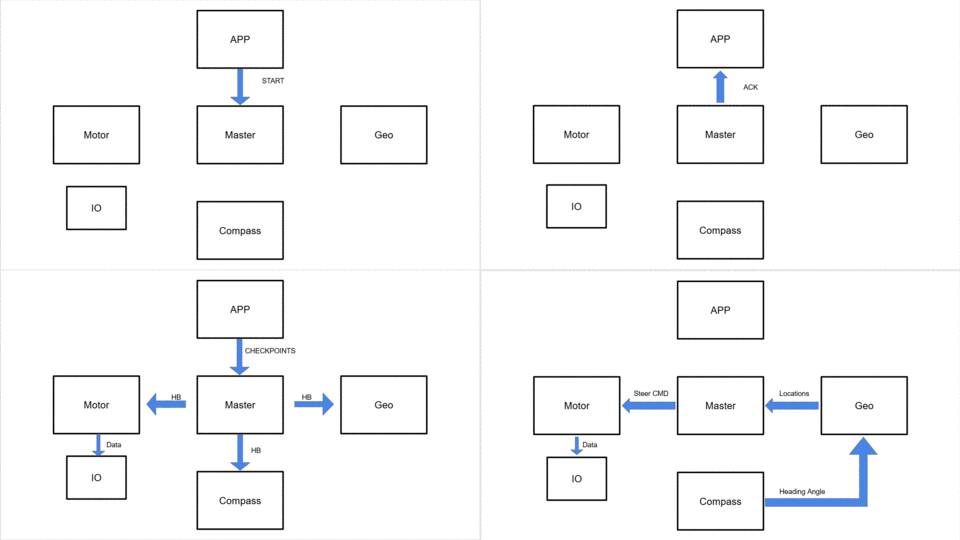
| − | [[File: | + | [[File:CMPE243_F16_Titans_Message_Flow.gif|800px|center|thumb|High level system]] |
== Track Progress in KanBan == | == Track Progress in KanBan == | ||
* [https://kanban-chi.appspot.com/dashboard/5973450679648256/d-5973450679648256 Titans Kanban Board] | * [https://kanban-chi.appspot.com/dashboard/5973450679648256/d-5973450679648256 Titans Kanban Board] | ||
| + | |||
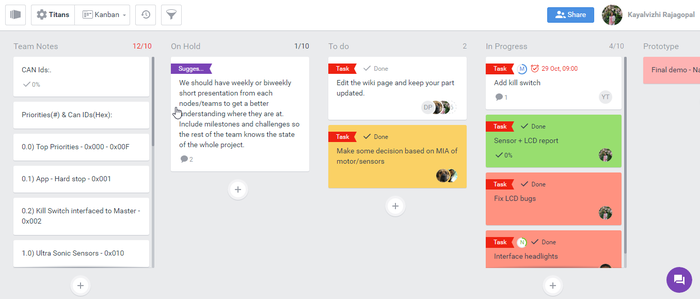
| + | We extensively used Kanban board to track our progress and keep the project on track. Below is the screenshot of the Titans' kanban board. | ||
| + | |||
| + | |||
| + | [[File:CMPE243 F16 Titans Kanban Kaban board.png|center|700px|thumb|Titans kanban board]] | ||
== Team Members & Responsibilities == | == Team Members & Responsibilities == | ||
| Line 41: | Line 46: | ||
** Urvashi Agrawal | ** Urvashi Agrawal | ||
* Motor Controller & I/O Module | * Motor Controller & I/O Module | ||
| − | ** Sant Prakash Soy | + | ** [https://www.linkedin.com/in/sant-prakash-soy-93898022 Sant Prakash Soy] |
** [https://www.linkedin.com/in/sakethsainarayana Saketh Sai Narayana] | ** [https://www.linkedin.com/in/sakethsainarayana Saketh Sai Narayana] | ||
** Kayalvizhi Rajagopal (LCD) | ** Kayalvizhi Rajagopal (LCD) | ||
| Line 293: | Line 298: | ||
|} | |} | ||
| + | |||
| + | == Changes to Python Script == | ||
| + | The auto generated code from the dbc file was generated using the python script provided by the Professor which was embedded in the eclipse package. During the course of extensive testing, we found out couple of bugs in the python script which were needed to be solved. | ||
| + | <br>The first bug was that the python script did not allow us to use the "double" data type. The float works fine for decimal digits, but while testing we figured out that the floating point variables are not accurate upto 6 digits after the decimal points. The GPS coordinates needs accuracy till 6 digits after the decimal points or else the it creates a huge problem for navigation. So we made a change to the following function in the python script to include the "double" datatype.<br> | ||
| + | def get_code_var_type(self): | ||
| + | if self.scale_str.count(".00000")>=1: | ||
| + | return "double" | ||
| + | elif '.' in self.scale_str: | ||
| + | return "float" | ||
| + | else: | ||
| + | if not is_empty(self.enum_info): | ||
| + | return self.name + "_E" | ||
| + | _max = (2 ** self.bit_size) * self.scale | ||
| + | if self.is_real_signed(): | ||
| + | _max *= 2 | ||
| + | t = "uint32_t" | ||
| + | if _max <= 256: | ||
| + | t = "uint8_t" | ||
| + | elif _max <= 65536: | ||
| + | t = "uint16_t" | ||
| + | # If the signal is signed, or the offset is negative, remove "u" to use "int" type. | ||
| + | if self.is_real_signed() or self.offset < 0: | ||
| + | t = t[1:] | ||
| + | return t | ||
| + | The second bug was that the python script detects MIA for a node once, but if that node comes out of the MIA, the local board doesn't detect that. So if a node went to MIA and it was detected by the local node, even if the MIA-ed node comes back on the bus, the local node never detects it unless we reset the board. So we made the changes to following function to incorporate that:<br> | ||
| + | def _get_mia_func_body(self, msg_name): | ||
| + | code = '' | ||
| + | code += ("{\n") | ||
| + | code += (" bool mia_occurred = false;\n") | ||
| + | code += (" const dbc_mia_info_t old_mia = msg->mia_info;\n") | ||
| + | code += (" msg->mia_info.is_mia = (msg->mia_info.mia_counter_ms >= " + msg_name + "__MIA_MS);\n") | ||
| + | code += ("\n") | ||
| + | code += (" if (!msg->mia_info.is_mia) { // Not MIA yet, so keep incrementing the MIA counter\n") | ||
| + | code += (" msg->mia_info.mia_counter_ms += time_incr_ms;\n") | ||
| + | code += (" }\n") | ||
| + | code += (" else if(!old_mia.is_mia) { // Previously not MIA, but it is MIA now\n") | ||
| + | code += (" // Copy MIA struct, then re-write the MIA counter and is_mia that is overwriten\n") | ||
| + | code += (" *msg = " + msg_name + "__MIA_MSG;\n") | ||
| + | code += (" msg->mia_info.mia_counter_ms = 0;\n") | ||
| + | code += (" msg->mia_info.is_mia = true;\n") | ||
| + | code += (" mia_occurred = true;\n") | ||
| + | code += (" }\n") | ||
| + | code += ("\n return mia_occurred;\n") | ||
| + | code += ("}\n") | ||
| + | return code | ||
== CAN bus design == | == CAN bus design == | ||
| Line 479: | Line 529: | ||
===== 3D Printing Design ===== | ===== 3D Printing Design ===== | ||
| − | Sensors are required to be placed at a minimum height of 18 cm from the ground and at a tilt of 5 degrees to avoid ground reflections. A proper mount is required to place them at adjustable angles and heights. Hence the mounts are 3D printed using the below 3D deigns. The heights are adjustable by adding mode standoffs and the angle is adjustable by using the bottom screws. | + | Sensors are required to be placed at a minimum height of 18 cm from the ground and at a tilt of 5 degrees to avoid ground reflections. A proper mount is required to place them at adjustable angles and heights. Hence the mounts are 3D printed using the below 3D deigns. The heights are adjustable by adding mode standoffs and the angle is adjustable by using the bottom screws.<br> |
| − | + | Design reference: [http://www.socialledge.com/sjsu/index.php?title=F14:_Self_Driving_Undergrad_Team F14: Self Driving Undergrad Team] | |
| − | [[File:CMPE243 F16 Titans Sensor Middle Sensor Mount 3D Design.jpg| | + | <center> |
| − | [[File:CMPE243 F16 Titans Sensor Side Sensors Mount 3D Design.jpg|centre|400px|thumb|3D Design for Middle Sensor mount]]< | + | <table> |
| + | <tr> | ||
| + | <td> | ||
| + | [[File:CMPE243 F16 Titans Sensor Middle Sensor Mount 3D Design.jpg|center|400px|thumb|3D Design for Middle Sensor mount]] | ||
| + | </td> | ||
| + | <td> | ||
| + | [[File:CMPE243 F16 Titans Sensor Side Sensors Mount 3D Design.jpg|centre|400px|thumb|3D Design for Middle Sensor mount]] | ||
| + | </td> | ||
| + | </tr> | ||
| + | </table> | ||
| + | </center> | ||
=== Hardware Interface === | === Hardware Interface === | ||
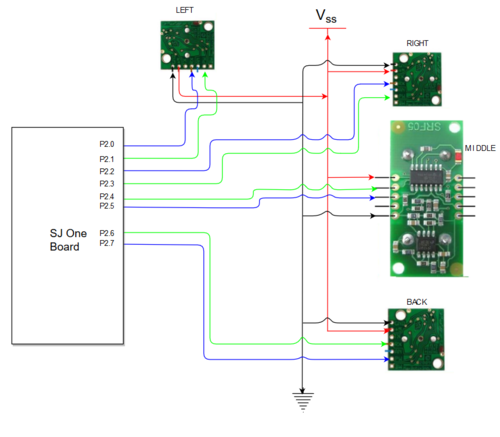
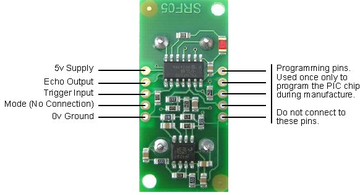
The sensors are interfaced using GPIO pins. CAN 1 of the sensor controller is interfaced to the CAN bus of the car. Below diagram shows the hardware interface between the micro controller, sensors and the CAN bus. | The sensors are interfaced using GPIO pins. CAN 1 of the sensor controller is interfaced to the CAN bus of the car. Below diagram shows the hardware interface between the micro controller, sensors and the CAN bus. | ||
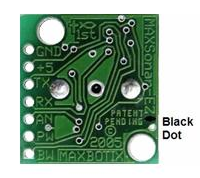
Note: If Maxbotix EZ series is used, makes sure the intended model is what got shipped. The black dot represent 'EZ0' model. Do not mix up the models unless you know what you are doing. | Note: If Maxbotix EZ series is used, makes sure the intended model is what got shipped. The black dot represent 'EZ0' model. Do not mix up the models unless you know what you are doing. | ||
| − | [[File:CMPE243 F16 Titans Sensor Pin connections.png| | + | <center> |
| − | < | + | <table> |
| − | [[File:CMPE243 F16 Titans Sensor Devantech(middle) sensor pinout.png| | + | <tr> |
| − | [[File:CMPE243 F16 Titans Sensor Maxbotix EZ0 pinout.png| | + | <td rowspan="2"> |
| − | < | + | [[File:CMPE243 F16 Titans Sensor Pin connections.png|center|500x600px|thumb|Sensors pin connections]] |
| − | < | + | </td> |
| − | < | + | <td> |
| − | + | [[File:CMPE243 F16 Titans Sensor Devantech(middle) sensor pinout.png|center|360px|thumb|Devantech(middle) sensor pinout]] | |
| − | === Software Design === | + | </td> |
| − | Software is designed such that the no two sensors of same type/model close by will be triggered simultaneously, so as to avoid interference with each other. Since the left and right sensor are of the same model, they are triggered sequentially, every 50 ms. The Maxbotix sensors cannot be triggered faster than 49 ms because it takes the sensors a maximum of 49 ms to pull down the PWN pin low when there is no obstacle for 6 meters or 254 inches. If triggered sooner, the reflected waves from the sensor will interfere with the next sensor, giving unpredictable values. The middle sensor and the back sensor are triggered every 50 ms. Hence we get all 4 sensor readings in 100 ms. The triggering of sensors is handled in 1 ms task, but with the check to trigger only every 50 ms. | + | </tr> |
| + | <tr> | ||
| + | <td> | ||
| + | [[File:CMPE243 F16 Titans Sensor Maxbotix EZ0 pinout.png|left|300px|thumb|Maxbotix EZ0 sensor pinout]] | ||
| + | </td> | ||
| + | </tr> | ||
| + | </table> | ||
| + | </center> | ||
| + | |||
| + | === Software Design === | ||
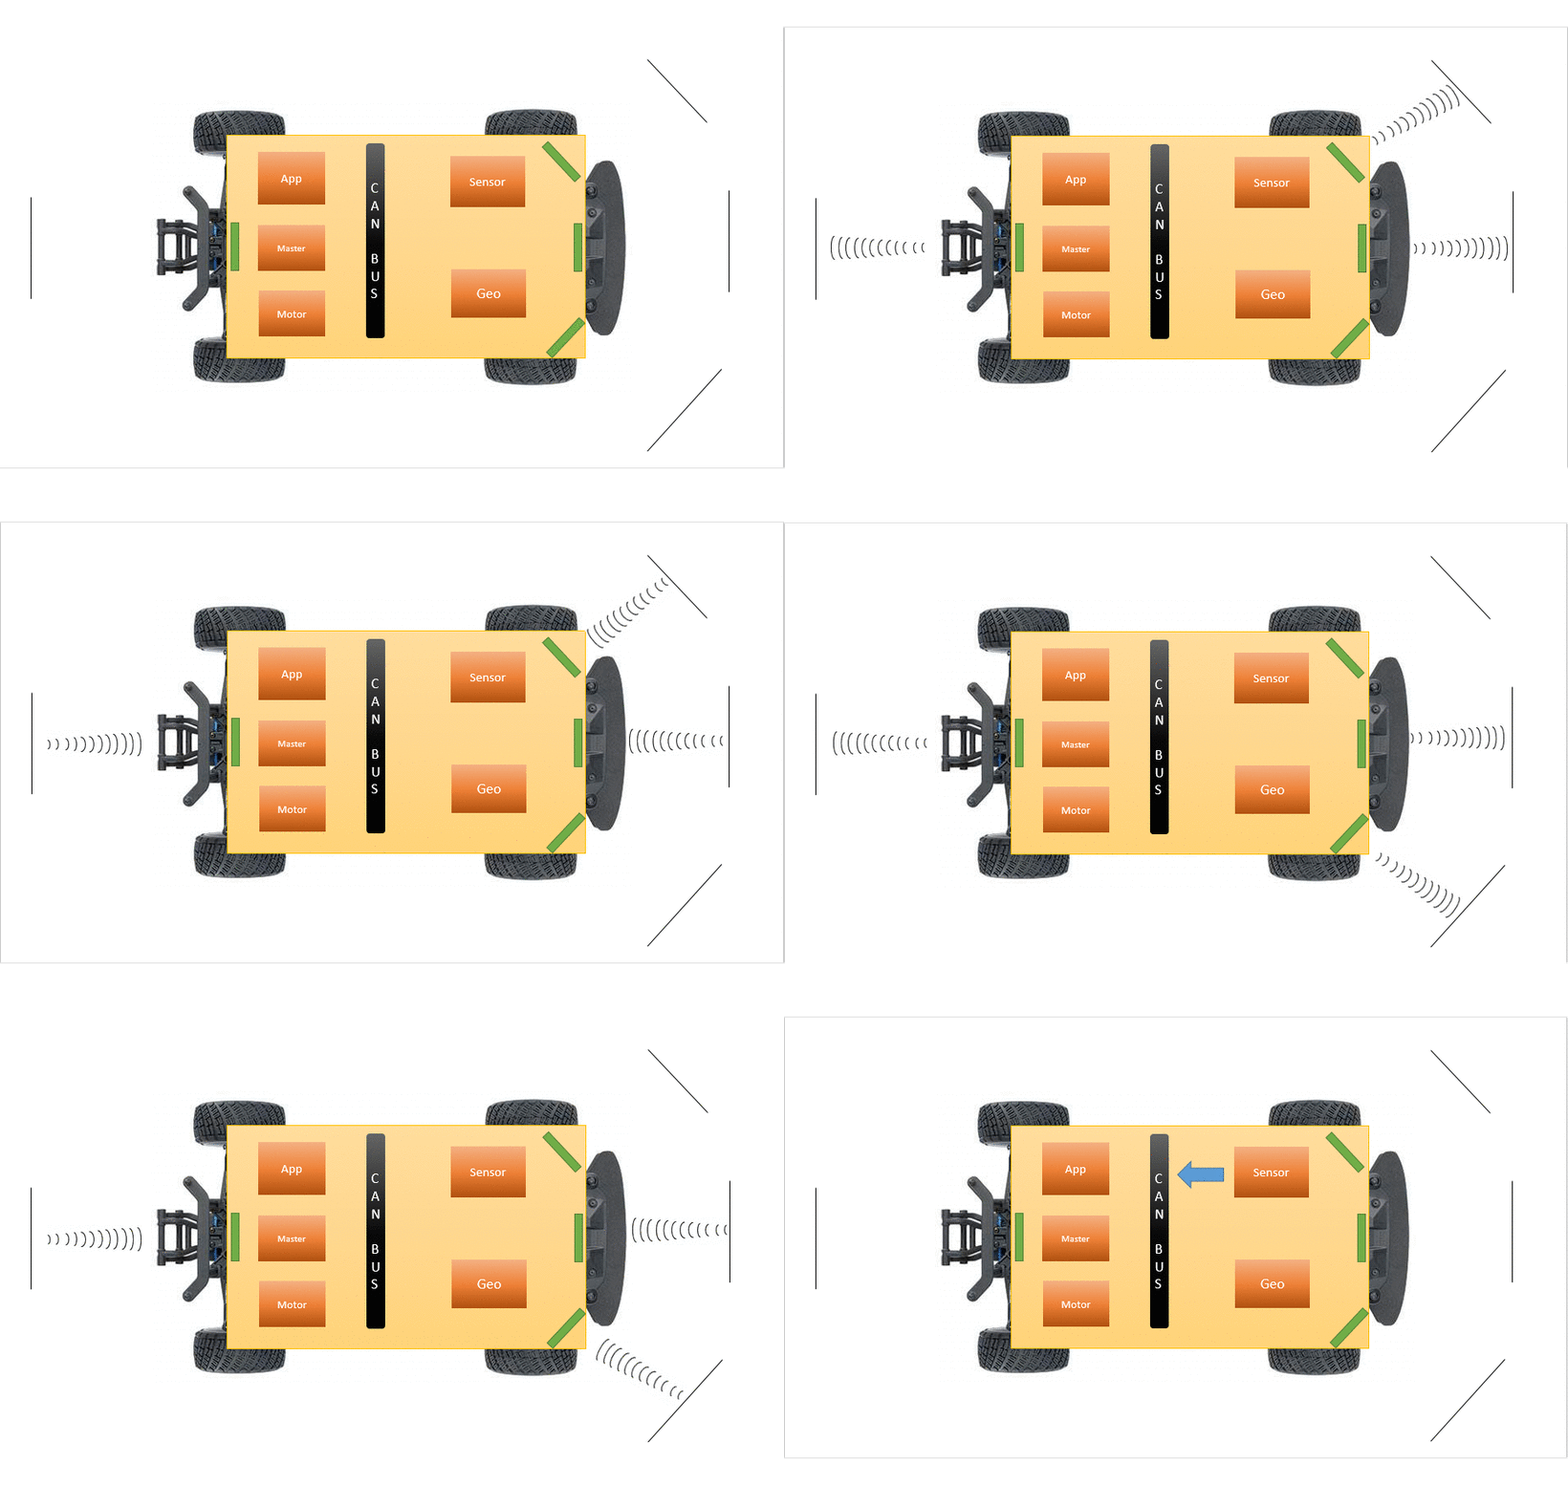
| + | Software is designed such that the no two sensors of same type/model close by will be triggered simultaneously, so as to avoid interference with each other. Since the left and right sensor are of the same model, they are triggered sequentially, every 50 ms. The Maxbotix sensors cannot be triggered faster than 49 ms because it takes the sensors a maximum of 49 ms to pull down the PWN pin low when there is no obstacle for 6 meters or 254 inches. If triggered sooner, the reflected waves from the sensor will interfere with the next sensor, giving unpredictable values. The middle sensor and the back sensor are triggered every 50 ms. Hence we get all 4 sensor readings in 100 ms. The triggering of sensors is handled in 1 ms task, but with the check to trigger only every 50 ms. | ||
Refer the below datasheets for timing information for triggering and detailed working of both sensor models. | Refer the below datasheets for timing information for triggering and detailed working of both sensor models. | ||
| Line 581: | Line 651: | ||
==== Filters ==== | ==== Filters ==== | ||
Filtering is an important step in removing unwanted glitches in the sensor readings. Mode filtering is deployed to all 4 sensor readings. Below is the plot of sensor readings with and without filters in an extreme scenario where there are many moving objects at different distances | Filtering is an important step in removing unwanted glitches in the sensor readings. Mode filtering is deployed to all 4 sensor readings. Below is the plot of sensor readings with and without filters in an extreme scenario where there are many moving objects at different distances | ||
| − | < | + | <center> |
| − | [[File:CMPE243 F16 Titans Sensor Left right sensor without filtering.png| | + | <table> |
| − | [[File:CMPE243 F16 Titans Sensor left right readings after filtering.png| | + | <tr> |
| − | < | + | <td>[[File:CMPE243 F16 Titans Sensor Left right sensor without filtering.png|center|500px|thumb|Left and right readings without filtering]]</td> |
| + | <td>[[File:CMPE243 F16 Titans Sensor left right readings after filtering.png|center|500px|thumb|Left and right readings after filtering]]</td> | ||
| + | </tr> | ||
| + | </table> | ||
| + | </center> | ||
=== Testing & Technical Challenges === | === Testing & Technical Challenges === | ||
| Line 595: | Line 669: | ||
6. The ultrasonic sensors are limited in their abilities. Because of the peculiar nature of ultrasonic waves, ultrasonic sensors require that a target be on | 6. The ultrasonic sensors are limited in their abilities. Because of the peculiar nature of ultrasonic waves, ultrasonic sensors require that a target be on | ||
axis and the readings will be unreliable when the target is at an angle to the sensor, especially when the target is a hard, flat surface like a wall. Consider different sensors like LIDAR. Below graphs show how the sensor readings were fluctuating when the sensor is at an angle to the wall.<br> | axis and the readings will be unreliable when the target is at an angle to the sensor, especially when the target is a hard, flat surface like a wall. Consider different sensors like LIDAR. Below graphs show how the sensor readings were fluctuating when the sensor is at an angle to the wall.<br> | ||
| − | [[File:CMPE243 F16 Titans Sensor Middle sensor at an angle to the wall.png| | + | <center> |
| − | [[File:CMPE243 F16 Titans Sensor Middle sensor at 90 dgree to the wall.png| | + | <table> |
| − | < | + | <tr> |
| + | <td>[[File:CMPE243 F16 Titans Sensor Middle sensor at an angle to the wall.png|center|380px|thumb| Middle sensor at 30 degrees to the wall]]</td> | ||
| + | <td>[[File:CMPE243 F16 Titans Sensor Middle sensor at 90 dgree to the wall.png|center|550px|thumb| Middle sensor at 90 degrees to the wall]]</td> | ||
| + | </tr> | ||
| + | </table> | ||
| + | </center> | ||
== Motor & I/O Controller == | == Motor & I/O Controller == | ||
| Line 708: | Line 787: | ||
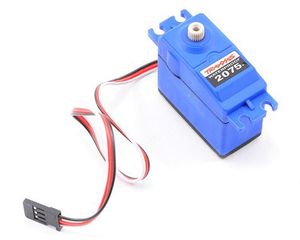
[[File:Cmpe243_F16_Titans_SERVO_MOTOR.jpg|300x300px|thumb|right|SERVO MOTOR: Traxxas Waterproof Digital Ball Bearing Servo (#TRA2075)]] | [[File:Cmpe243_F16_Titans_SERVO_MOTOR.jpg|300x300px|thumb|right|SERVO MOTOR: Traxxas Waterproof Digital Ball Bearing Servo (#TRA2075)]] | ||
| − | The servo motor is the component responsible for the steering of the car. The servo motor is | + | The servo motor is the component responsible for the steering of the car. The servo motor is controlled directly from the SJOne micro-controller board. It has three color coded wire white, red and black which are used for PWM signal, 5 Volts and GND respectively. Based on the duty cycle of the signal sent to the servo, it rotates in left/right direction. The PWM signal fed to the servo motor is of frequency 100Hz. Detailed duty cycle values and corresponding steering position are provided in the software design section. |
| − | |||
| Line 747: | Line 825: | ||
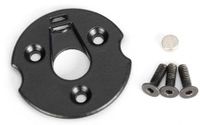
The speed sensor is one of the hardware component used in the autonomous car for sensing the speed of the car and feeding the information to SJOne microcontroller. The sensor is installed in the gear compartment of the Traxxas car along with the magnet trigger. When the magnet attached to the spur gear rotates along with the gear it passes the hall-effect RPM sensor after every revolution. As soon as the magnet comes in front of the sensor the sensor sends a pulse on the signal line which is color coded as white. The other color coded wires red and black are used for VCC and GND to power the sensor. The sensor is powered using the 5 volts power supply from the power bank. | The speed sensor is one of the hardware component used in the autonomous car for sensing the speed of the car and feeding the information to SJOne microcontroller. The sensor is installed in the gear compartment of the Traxxas car along with the magnet trigger. When the magnet attached to the spur gear rotates along with the gear it passes the hall-effect RPM sensor after every revolution. As soon as the magnet comes in front of the sensor the sensor sends a pulse on the signal line which is color coded as white. The other color coded wires red and black are used for VCC and GND to power the sensor. The sensor is powered using the 5 volts power supply from the power bank. | ||
| − | |||
| Line 775: | Line 852: | ||
|} | |} | ||
| − | + | [[File:Cmpe243_F16_Titans_RPM_SENSOR.jpg|150x200px|thumb|right|RPM SENSOR: Traxxas Sensor RPM Short 3x4mm BCS (#TRA6522)]] | |
| − | |||
| − | |||
| − | |||
| − | |||
==== IO module ==== | ==== IO module ==== | ||
| Line 795: | Line 868: | ||
The second phase of the motor controlling is maintaining a constant speed i,e., to find out the speed at which it is running and control the car based on the speed at which it is traveling. This comes in handy when the car has a destination that goes uphill. This operation can be called as speed controlling. This operation is done with the help of a speed sensor that can be fixed either on to the wheel or on to the transmission box of the car. | The second phase of the motor controlling is maintaining a constant speed i,e., to find out the speed at which it is running and control the car based on the speed at which it is traveling. This comes in handy when the car has a destination that goes uphill. This operation can be called as speed controlling. This operation is done with the help of a speed sensor that can be fixed either on to the wheel or on to the transmission box of the car. | ||
| + | |||
| + | [[File:CMPE243_F16_Titans_Steer_PWM_Signal.gif|right|820x518px|thumb|Steering Positions and corresponding % Duty Cycle]] | ||
==== DC Motor and Servo Motor ==== | ==== DC Motor and Servo Motor ==== | ||
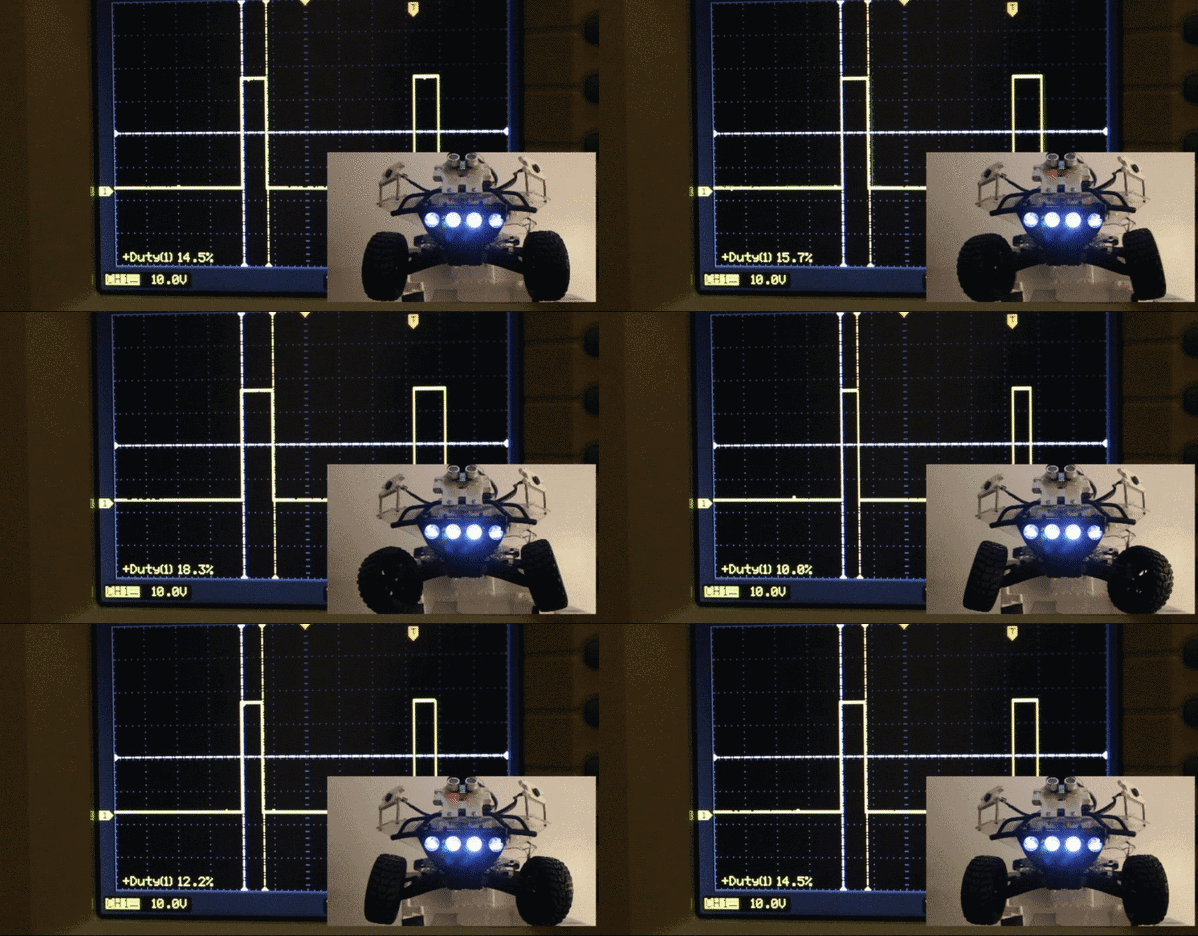
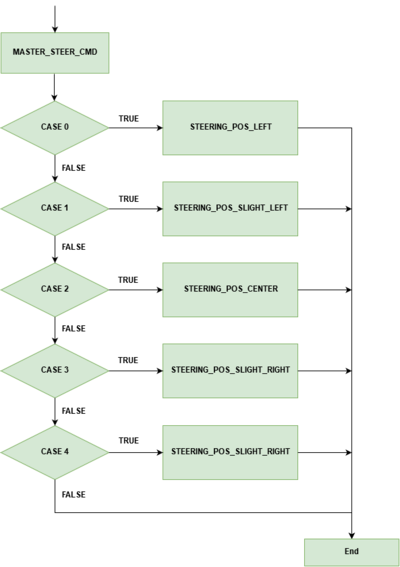
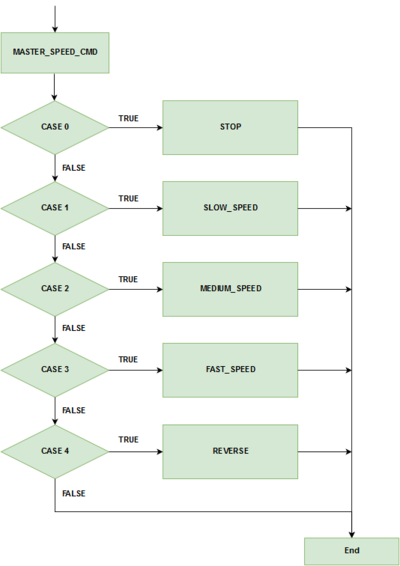
| − | Software design for the speed control and steering control is done using 5Hz and 10Hz periodic loop respectively. The periodic loop consists of two switch cases, one switch case for speed control and another one for steering control. For speed control, switch cases are for stop, 'slow' speed, 'medium' speed, 'fast' speed, and reverse. For steering control, the switch cases are for the positions of the wheel that are 'hard' left, 'slight' left, center, 'slight' right and 'hard' right. After the CAN message for speed and steering are decoded, the values are fed into switch cases for speed and steering control. Based on the values of the steering and speed sent by the master, motor controller takes action. | + | Software design for the speed control and steering control is done using 5Hz and 10Hz periodic loop respectively. The periodic loop consists of two switch cases, one switch case for speed control and another one for steering control. For speed control, switch cases are for stop, 'slow' speed, 'medium' speed, 'fast' speed, and reverse. For steering control, the switch cases are for the positions of the wheel that are 'hard' left, 'slight' left, center, 'slight' right and 'hard' right. After the CAN message for speed and steering are decoded, the values are fed into switch cases for speed and steering control. Based on the values of the steering and speed sent by the master, motor controller takes action. Below flowchart are for steering control and speed control, which shows a command being received from master which is then used in a switch case to choose between different steering positions and speeds. The provided gif here shows change in five steering positions and their respective PWM duty cycle applied to the servo motor. The macro defined for the duty cycle below are percentage of the duty cyle for PWM signal applied to the servo. For our design these are X percentage of 100Hz, which is the frequency of the PWM signal used to control the servo motor. |
| + | |||
| + | #define STEERING_POS_LEFT 10 | ||
| + | #define STEERING_POS_SLIGHT_LEFT 12 | ||
| + | #define STEERING_POS_CENTER 14 | ||
| + | #define STEERING_POS_SLIGHT_RIGHT 16 | ||
| + | #define STEERING_POS_RIGHT 18 | ||
[[File:CMPE243 Titans Steering flowchart.png.png|left|400px|thumb|Steering Control Flowchart]] | [[File:CMPE243 Titans Steering flowchart.png.png|left|400px|thumb|Steering Control Flowchart]] | ||
[[File:CMPE243 Titans Speed flowchart.png.png|right|400px|thumb|Speed, Forward and Reverse selection Flowchart]] | [[File:CMPE243 Titans Speed flowchart.png.png|right|400px|thumb|Speed, Forward and Reverse selection Flowchart]] | ||
| + | <br> | ||
| + | <br> | ||
| + | |||
| + | <br> | ||
| + | <br> | ||
| + | <br> | ||
| + | <br> | ||
| + | <br> | ||
| + | <br> | ||
| + | <br> | ||
| + | <br> | ||
| + | <br> | ||
| + | <br> | ||
| + | <br> | ||
| + | <br> | ||
| + | <br> | ||
| + | <br> | ||
| + | <br> | ||
| + | |||
| + | <br> | ||
| + | <br> | ||
| + | <br> | ||
| + | <br> | ||
| + | <br> | ||
| + | <br> | ||
| + | <br> | ||
| + | <br> | ||
| + | <br> | ||
| + | <br> | ||
| − | <br><br><br><br> | + | <br> |
| + | <br> | ||
| + | <br> | ||
| + | <br> | ||
| + | |||
| + | <br> | ||
==== RPM Sensor ==== | ==== RPM Sensor ==== | ||
| Line 812: | Line 927: | ||
mph = 5 * (((2 * PI * WHEEL_RADIUS) * no_of_revolution * SECS_PER_HOUR) / (CENTIMETERS_PER_MILES * FINAL_DRIVE)); | mph = 5 * (((2 * PI * WHEEL_RADIUS) * no_of_revolution * SECS_PER_HOUR) / (CENTIMETERS_PER_MILES * FINAL_DRIVE)); | ||
| + | NOTE: Multiplier value 5 is used to convert calculation of no_of_revolution every 200 ms to 1 second which depends on the periodic loop the | ||
| + | above code is running in. | ||
Macros used for above parameter are given below: | Macros used for above parameter are given below: | ||
| Line 821: | Line 938: | ||
#define CENTIMETERS_PER_MILES 160934.4 | #define CENTIMETERS_PER_MILES 160934.4 | ||
| − | Other than providing the speed at which the car is moving, the RPM sensor has another critical functionality which is the speed control. For constant speed control we have implemented a Proportional and Integral (PI) controller that takes care of speed control up and down any slope which would otherwise be variable due to gravity. Based on the output from the PI controller, the PWM duty cycle is added to the duty cycle already provided for slow speed. If the actual speed calculated using the RPM sensor is less than the set speed (slow speed),case during uphill, the error is positive. So in this case the PI controller increments the the duty cycle to reach the set speed. On the other hand when the actual speed is more than that of the set speed,which is the case during downhill, the error is negative so the PI controller tries to decrease the duty cycle in order to reduce the speed down to the set speed. | + | Other than providing the speed at which the car is moving, the RPM sensor has another critical functionality which is the speed control. For constant speed control we have implemented a Proportional and Integral (PI) controller that takes care of speed control up and down any slope which would otherwise be variable due to gravity. Based on the output from the PI controller, the PWM duty cycle is added to the duty cycle already provided for slow speed. If the actual speed calculated using the RPM sensor is less than the set speed (slow speed),case during uphill, the error is positive. So in this case the PI controller increments the the duty cycle to reach the set speed. On the other hand when the actual speed is more than that of the set speed,which is the case during downhill, the error is negative so the PI controller tries to decrease the duty cycle in order to reduce the speed down to the set speed. Although, our actual PI controller code contains lot of filters to confine speed within safe limits , snippet for basic PI controller is provided below to show the flow of calculation for proportional and integral values for speed control. |
| + | |||
| + | error = set_speed - pi_mph; //Error between set speed and the actual speed of the car | ||
| + | p_controller = Kp * error; //Calculation of the proportional value based on the errors | ||
| + | i_controller = Ki * speed_error_sum; //Calculation of the integral value based on the sum of previous error | ||
| + | speed_error_sum = speed_error_sum + error; //Calculation of sum of previous errors | ||
| + | duty_cycle = p_controller + i_controller; //Controller output based on integral and proportional value | ||
==== IO module ==== | ==== IO module ==== | ||
| Line 1,294: | Line 1,417: | ||
</td> | </td> | ||
<td width="20%"> | <td width="20%"> | ||
| − | [[File:Devtutorial_SjOneBoardOverlay.png| | + | [[File:Devtutorial_SjOneBoardOverlay.png|130px|thumb|center|SJOne Board]] |
</td> | </td> | ||
</tr> | </tr> | ||
</table> | </table> | ||
| + | |||
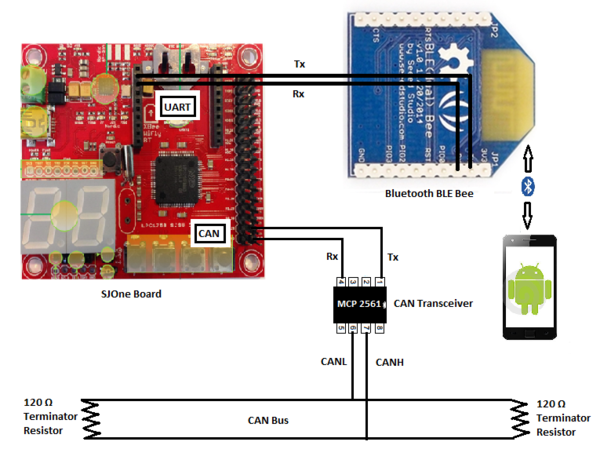
===== 2. Bluetooth BLE Dual Bee ===== | ===== 2. Bluetooth BLE Dual Bee ===== | ||
<table width="100%"> | <table width="100%"> | ||
| Line 1,313: | Line 1,437: | ||
</td> | </td> | ||
<td width="20%"> | <td width="20%"> | ||
| − | [[File:CMPE243_F16_Titans_BLE_Bee.jpg| | + | [[File:CMPE243_F16_Titans_BLE_Bee.jpg|130px|thumb|center|Bluetooth BLE]] |
</td> | </td> | ||
</tr> | </tr> | ||
| Line 1,332: | Line 1,456: | ||
</td> | </td> | ||
<td width="20%"> | <td width="20%"> | ||
| − | [[File:CMPE243_F16_Titans_MCP2561.PNG| | + | [[File:CMPE243_F16_Titans_MCP2561.PNG|130px|thumb|center|CAN Transceiver]] |
</td> | </td> | ||
</tr> | </tr> | ||
| Line 1,378: | Line 1,502: | ||
==== Usecase Diagram ==== | ==== Usecase Diagram ==== | ||
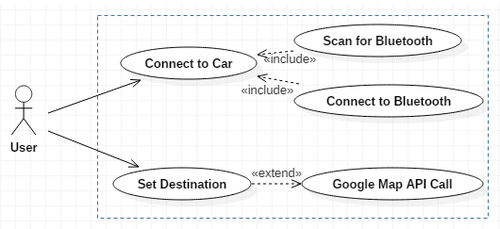
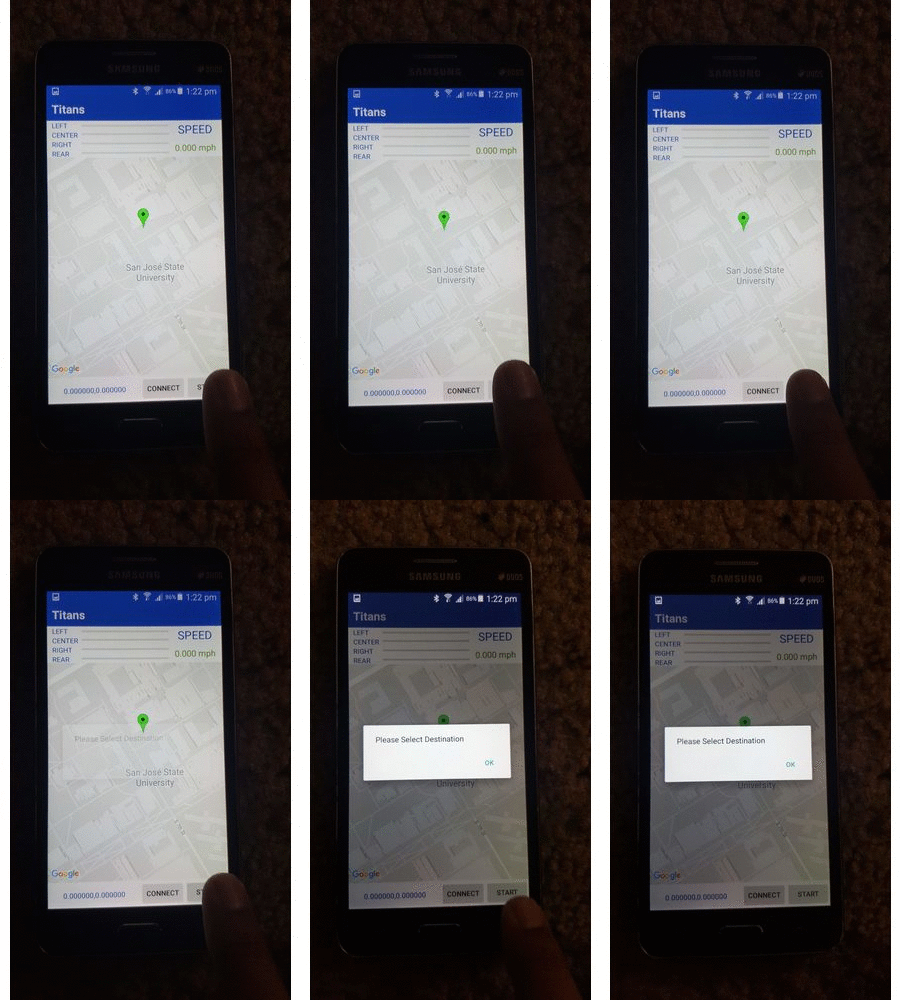
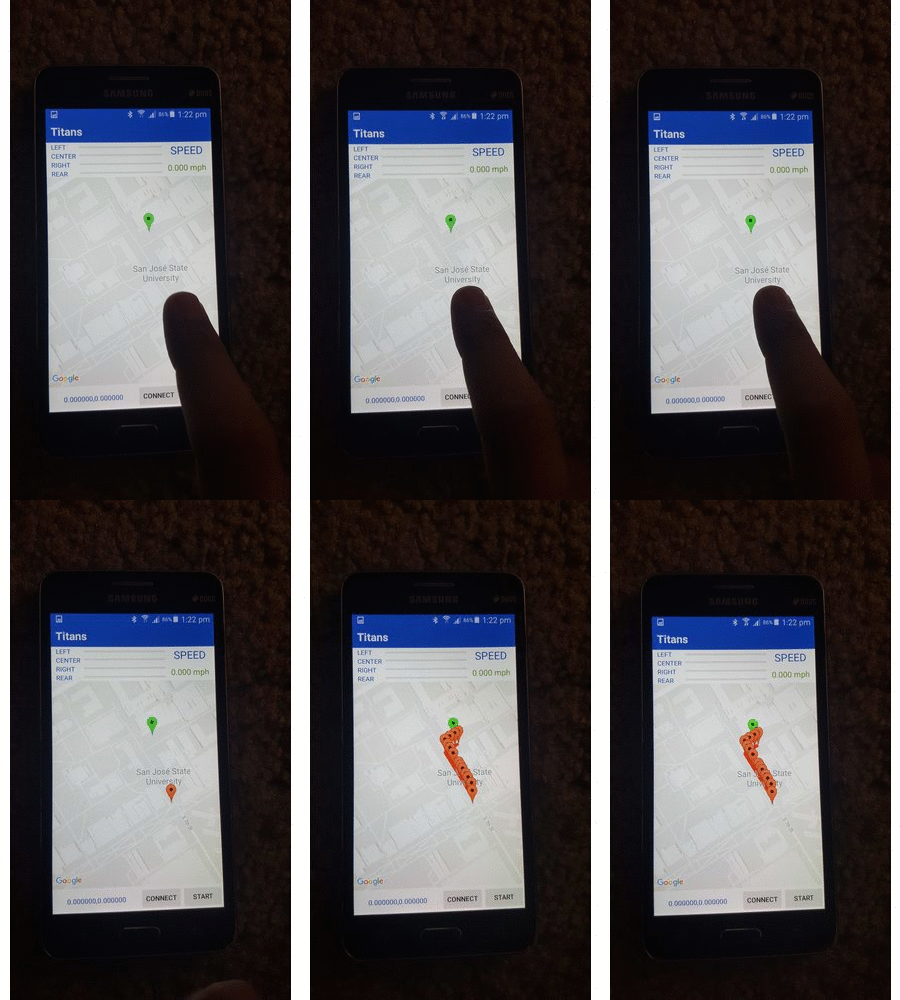
| − | Following is the abstract | + | Since the android application and the bridge controller is the only module on the whole car which comes in direct contact with the user, we have a use case diagram. The use case diagram is pretty simple as the role of the user in this project is limited to connecting to the car and selecting the final destination. The use case of connecting to the car includes the whole process of bluetooth connection process. The use case for giving the final destination includes the whole google maps api call and getting the checkpoints.<br> |
| + | Following is the abstract view of our system and how user can interact with our system. The usecase diagram here describes that user can connect with the car and set the destination for the car using the android app designed for this project. | ||
[[File:CMPE243_F16_Titans_Usecase.png|500px|center|thumb|Usecase Diagram]] | [[File:CMPE243_F16_Titans_Usecase.png|500px|center|thumb|Usecase Diagram]] | ||
| + | |||
==== Statechart Diagram ==== | ==== Statechart Diagram ==== | ||
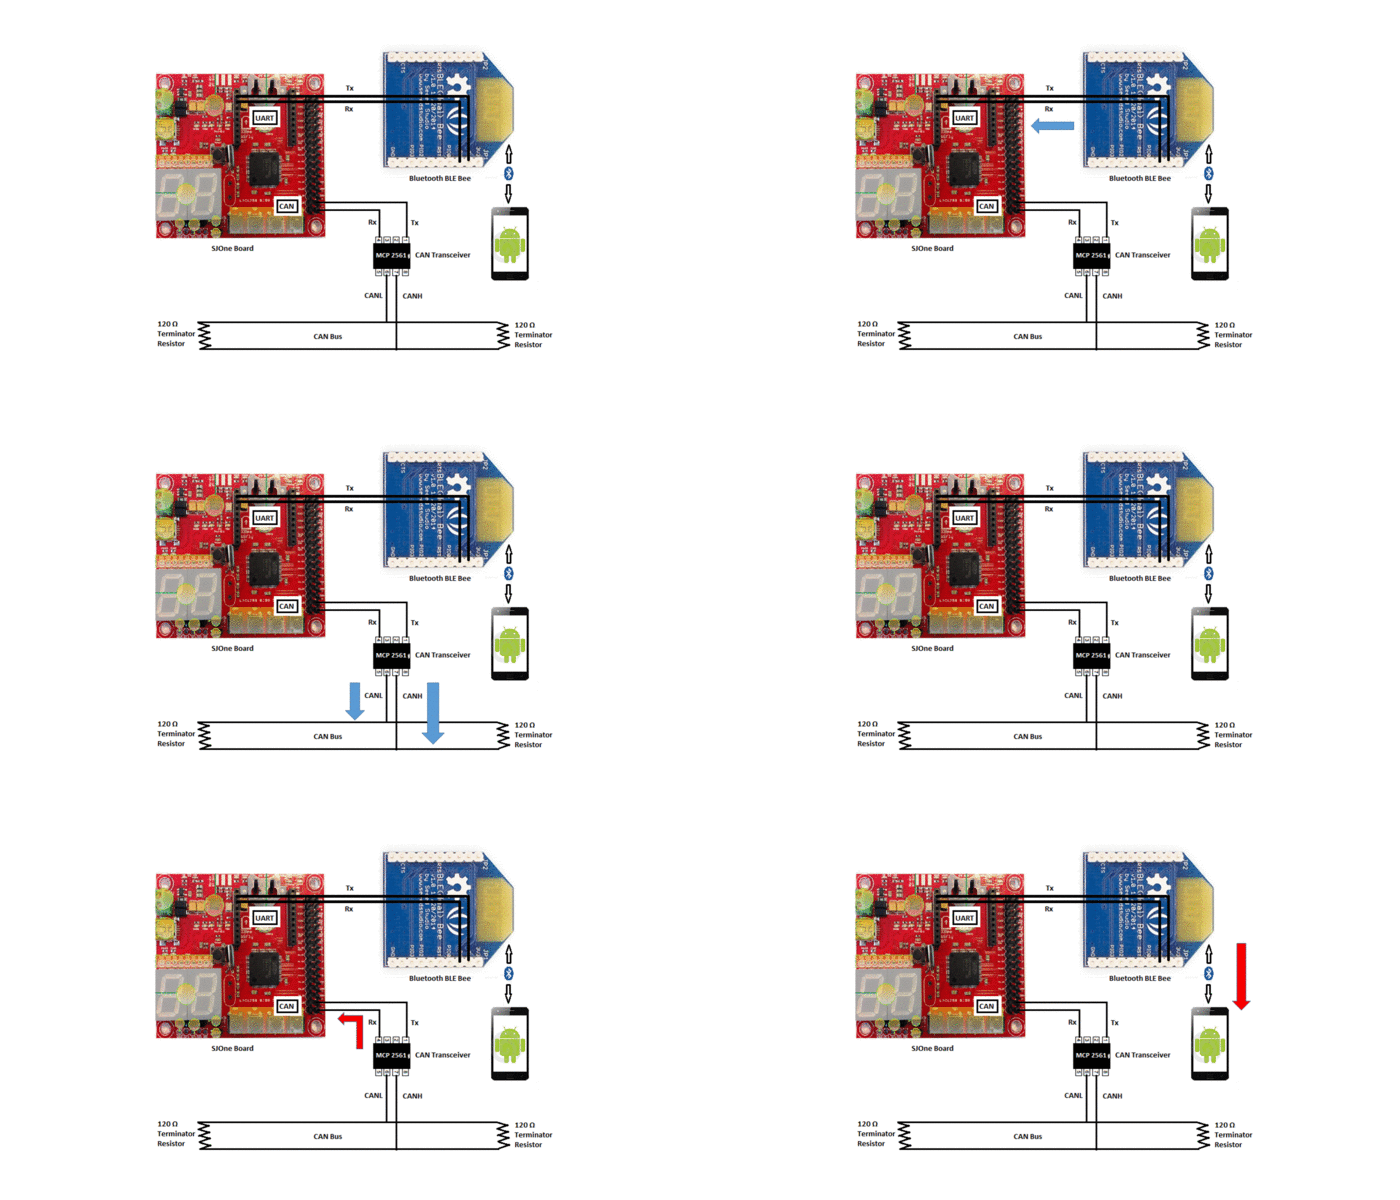
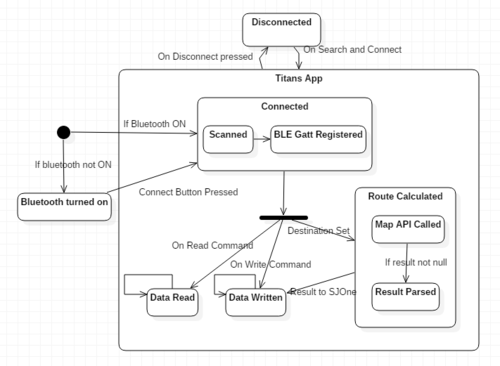
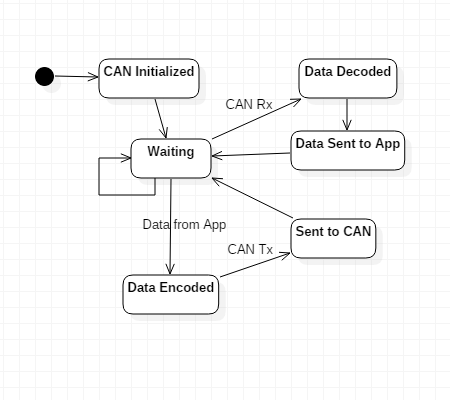
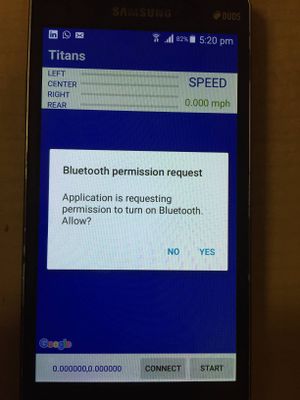
| − | The state diagram is a behavior diagram that shows the behavior of our system at particular instance of time. The following | + | The state diagram is a behavior diagram that shows the behavior of our system at particular instance of time. <br> For android application, since we used the Bluetooth BLE module, our whole bluetooth connection algorithm was a state machine. The BLE module uses Gatt server and client methodology for connection. So when we open the app, it first checks for bluetooth, if it is powered on. Once it is powered on, it goes in connection state where it checks if the GATT server is registered or not. Once it connects with module it goes into data read and write state. Since, read and write doesn't happen in parallel, it toggles between these two states. Once the destination is given it goes into the state of calculating the route and writing on to the bluetooth module.While for the SJ One board, the states are pretty simple. As soon as the board boots, it goes into the waiting stage where it waits for the data to arrive from app or CAN bus. If the data arrives from the app, it encodes and sends the necessary data on the can. If the data arrives from CAN, it decodes the data and utilizes the same.<br> |
| + | The following shows the state chart diagram of Android application and SJ One board | ||
<center><table> | <center><table> | ||
<tr> | <tr> | ||
| Line 1,397: | Line 1,524: | ||
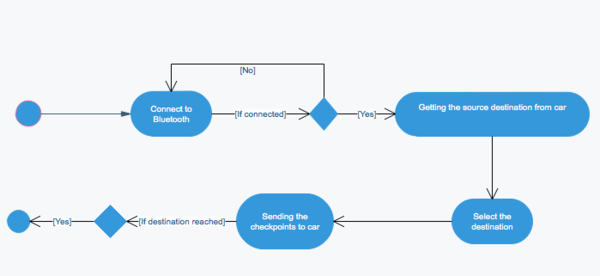
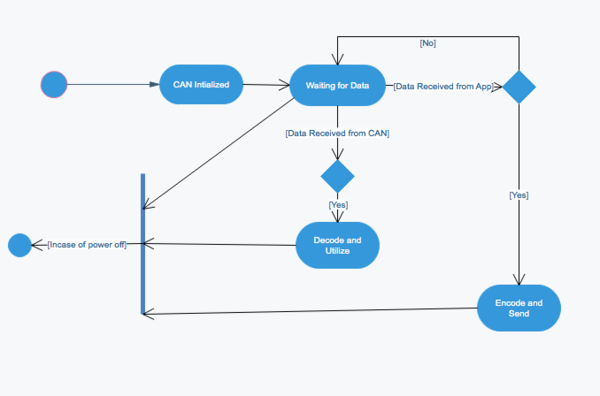
The diagram shows the different activities which are being performed on both the the application and the SJ One board. The activities being performed comes directly with user interaction while the activities on the board are in synchronous with application and other nodes. There is no direct user interaction for the activities on the SJ One board. | The diagram shows the different activities which are being performed on both the the application and the SJ One board. The activities being performed comes directly with user interaction while the activities on the board are in synchronous with application and other nodes. There is no direct user interaction for the activities on the SJ One board. | ||
The activity diagrams for the android application and SJ One board are as follows: | The activity diagrams for the android application and SJ One board are as follows: | ||
| − | [[File: | + | [[File:Cmpe243_Titans_Activity_Diagram_For_App.png|600px|center|thumb|Activity Diagram for Android application]] |
| − | [[File: | + | [[File:Cmpe243_Titans_ActivityDiagram_ForBoard.png|600px|center|thumb|Activity Diagram for SJ One Board]] |
=== Implementation === | === Implementation === | ||
| Line 1,546: | Line 1,673: | ||
The overall flow chart for the master controller is shown below. We had a lot of state machines in place and hence we were able to navigate through the path correctly. <br> | The overall flow chart for the master controller is shown below. We had a lot of state machines in place and hence we were able to navigate through the path correctly. <br> | ||
[[File:F16_243_Titans_Master_Flowchart.png|750px|thumb|centre|Master Overall Flowchart]] | [[File:F16_243_Titans_Master_Flowchart.png|750px|thumb|centre|Master Overall Flowchart]] | ||
| + | The flowchart below shows the master handling the geo node. | ||
| + | [[File:F16_243_Titans_Master_Geo_Flowchart.png|750px|thumb|centre|Master Geo Flowchart]] | ||
=== Testing & Technical Challenges === | === Testing & Technical Challenges === | ||
| Line 1,595: | Line 1,724: | ||
== Project Video == | == Project Video == | ||
| − | + | [https://youtu.be/-wyNyoxD6Js The Titans - Video]<br> | |
| + | [https://www.youtube.com/watch?v=vd2cP3UfQ88 The Titans - Self driving RC car video] | ||
== Project Source Code == | == Project Source Code == | ||
| Line 1,602: | Line 1,732: | ||
== References == | == References == | ||
=== Acknowledgement === | === Acknowledgement === | ||
| − | We, Team Titans, would like to thank | + | We, Team Titans, would like to thank Prof. Preetpal Kang for Industrial Applications using CAN bus course at SJSU and the continued guidance he provided through out the semester. The course content and his practical teaching helped with the implementation and testing of our project self-navigating car. We also appreciate our Student Assistants(ISAs) for their guidance during the project. Their feedback helped us get through tough obstacles. This project helped us gain the knowledge on various aspects of practical embedded system and also helped us hone our skills. This course and the project will be an asset to our career. |
=== References Used === | === References Used === | ||
| − | [1] CMPE 243 Lecture notes from Preetpal Kang, Computer Engineering, San Jose State University. Aug-Dec | + | [1] CMPE 243 Lecture notes from Preetpal Kang, Computer Engineering, San Jose State University. Aug-Dec 2016. |
[2] [http://www.socialledge.com/sjsu/index.php?title=Industrial_Application_using_CAN_Bus#Class_Project_Reports# Fall_2014 and Fall_2015 Project Reports] | [2] [http://www.socialledge.com/sjsu/index.php?title=Industrial_Application_using_CAN_Bus#Class_Project_Reports# Fall_2014 and Fall_2015 Project Reports] | ||
[3] [http://www.microchip.com/wwwproducts/Devices.aspx?dDocName=en010405 CAN Transceiver] | [3] [http://www.microchip.com/wwwproducts/Devices.aspx?dDocName=en010405 CAN Transceiver] | ||
| Line 1,615: | Line 1,745: | ||
[9] [http://www.4dsystems.com.au/productpages/uLCD-32PTU/downloads/uLCD-32PTU_datasheet_R_2_0.pdf LCD datasheet] | [9] [http://www.4dsystems.com.au/productpages/uLCD-32PTU/downloads/uLCD-32PTU_datasheet_R_2_0.pdf LCD datasheet] | ||
[10] [http://www.4dsystems.com.au/productpages/PICASO/downloads/PICASO_serialcmdmanual_R_1_20.pdf LCD user manual] | [10] [http://www.4dsystems.com.au/productpages/PICASO/downloads/PICASO_serialcmdmanual_R_1_20.pdf LCD user manual] | ||
| + | [11] Fall'15 and Fall'14 project reports | ||
Latest revision as of 01:26, 23 December 2016
Contents
- 1 Titans
- 2 Abstract
- 3 Objectives & Introduction
- 4 Track Progress in KanBan
- 5 Team Members & Responsibilities
- 6 Project Schedule
- 7 Parts List & Cost
- 8 Changes to Python Script
- 9 CAN bus design
- 10 Sensor Controller
- 11 Motor & I/O Controller
- 12 Geographical Controller
- 13 Communication Bridge Controller
- 14 Master Controller
- 15 Issues
- 16 Conclusion
- 17 Project Video
- 18 Project Source Code
- 19 References
Titans
Titans - Autonomous Navigating Car
Abstract
The aim of this project is to build a self navigating RC car. The car is build using 5 Electrical Control Units (ECU's). The main controller in the ECU's are the SJ One boards. These nodes which controls the whole car are sensors, motors, master, geo and bridge controller. Each node has its own particular task. The sensor node detects the obstacles on the way, the motors controls the motors of the car, the geo node does the distance calculation on the basis of the current position of the car and is also integrated with the compass so that the car remains on track to the destination. The bridge controller is connected to the android application which gives the route to the destination. The master is the brain of the car, it collects all the data from the controllers and takes the decisions based on the received data. All these controllers are connected via CAN bus. The communication happens between these nodes via the messages which are defined in the DBC file. All these five nodes combine to make the car drive autonomously avoiding obstacles and dynamically reaching the final destination on its own!
Objectives & Introduction
Introduction
With the advent of self-driven cars, the market is booming with the idea of a vehicle capable of driving itself. So, the idea is to develop a similar prototype of a vehicle which could autonomously drive itself to the destination. The functionality of autonomous driving is implemented on a Remote Controlled toy car. With such good micro-controllers available in the market, this task was indeed achievable. We used the SJ One boards which consists of LPC 1758 as the controlling devices for the five nodes. The controllers are loaded with FREERTOS operating system. The five nodes are as follows:
Sensor Node:- The main task of this node is to detect the obstacle on the path and report the master with distance to the obstacle
Motor Node:- The main task of this node is to control the motors according to the instructions given by the master. For example, to turn left, to turn right, reverse and so on.
GEO Node:- The main task of this node is to calculate the distance between the current position of the car and the next checkpoint. It also has compass interfaced on it which keeps the car on the right direction.
Bridge Controller:- The main task of this node is to take the checkpoints from the android application and send it to the master. Also, the start and stop command for the car is given on the application which is forwarded to the the master.
Master Node:- The master node receives all the data from the different nodes and taken decision based on the collected data. It's final decision is in terms of the commands given to the motor i.e. to turn left, turn right, stop, reverse and so on.
The communication between different nodes is done via CAN bus. The CAN bus modules are not very expensive which enables them to be used in variety of applications. The other parts used are sensors, gps, compass and Bluetooth BLE. The whole functioning of the car revolves around these parts. These parts are attached to five different controllers. The controllers collect and compute data from these parts and forward it to the main node which is the master node. The master node takes all the decisions. All the nodes work in synchronous fashion to drive the car forward.
Objectives
The objectives are as follows:
- To be able to detect the obstacle on the path and avoid it
- To be able to move at a constant speed and increase or reduce speed as per the path requirement
- To be able to integrate the gps and compass such that the car always stays on the track to the destination
- To be able to drive the car autonomously to any dynamic destination given through the application where a valid path exists
- To be able to work as a team to achieve the goal
Track Progress in KanBan
We extensively used Kanban board to track our progress and keep the project on track. Below is the screenshot of the Titans' kanban board.
Team Members & Responsibilities
- Master Controller
- Haroldo Filho
- Urvashi Agrawal
- Motor Controller & I/O Module
- Sant Prakash Soy
- Saketh Sai Narayana
- Kayalvizhi Rajagopal (LCD)
- GPS/Compass Module
- Yang Thao (GPS)
- Daamanmeet Paul (Compass)
- Sensors
- Kayalvizhi Rajagopal
- Communication Bridge/Android App
- Parth Pachchigar
- Purvil Kamdar
Project Schedule
Legend: Motor & I/O Controller , Master Controller , Communication Bridge Controller, Geographical Controller, Sensor Controller , Team Goal
| Week# | Start Date | End Date | Task | Status |
|---|---|---|---|---|
| 1 | 09/13/2016 | 09/20/2016 |
|
Completed |
| 2 | 09/21/2016 | 09/27/2016 |
|
Completed |
| 3 | 09/28/2016 | 10/04/2016 |
|
Completed |
| 4 | 10/05/2016 | 10/11/2016 |
|
Completed |
| 5 | 10/12/2016 | 10/17/2016 |
|
Completed |
| 6 | 10/18/2016 | 10/24/2016 |
|
Completed |
| 7 | 10/25/2016 | 10/31/2016 |
|
Completed |
| 8 | 11/1/2016 | 11/7/2016 |
|
Completed |
| 9 | 11/8/2016 | 11/14/2016 |
|
Completed |
| 10 | 11/15/2016 | 11/21/2016 |
|
Completed |
| 11 | 11/22/2016 | 11/28/2016 |
|
Completed |
| 12 | 11/22/2016 | 11/28/2016 |
|
Completed |
| 13 | 11/29/2016 | Presentation date |
|
In Progress |
Parts List & Cost
| Item# | Part Desciption | Vendor | Qty | Cost |
|---|---|---|---|---|
| 1 | RC Car - Traxxas 1/10 Slash 2WD | Amazon | 1 | $189.95 |
| 2 | Traxxas 2872X 5000mAh 11.1V 3S 25C LiPo Battery | Amazon | 1 | $56.99 |
| 3 | Traxxas 7600mAh 7.4V 2-Cell 25C LiPo Battery | Amazon | 1 | $70.99 |
| 4 | Traxxas 2970 EZ-Peak Plus 4-Amp NiMH/LiPo Fast Charger | Amazon | 1 | $35.99 |
| 5 | Bluetooth 4.0 BLE Bee Module (Dual Mode) | Robotshop | 1 | $19.50 |
| 6 | 4D systems 32u LCD | 4D systems | 1 | $41.55 |
| 7 | LV Maxsonar EZ0 Ultrasonic sensors | Robotshop | 5 | $124.75 |
| 8 | Devantech SF05 Ultrasonic sensor | Provided by Preet | 1 | Free |
| 9 | Venus GPS with SMA connector | Amazon | 1 | $49.95 |
| 10 | SMA Male Plug GPS Active Antenna | Amazon | 1 | $9.45 |
| 11 | Wire wrapping board | Radio shack | 1 | $20.0 |
| 12 | CAN tranceivers | Digikey | 10 | $10.0 |
| 13 | SJOne Boards | Provided by Preet | 5 | $400.0 |
Changes to Python Script
The auto generated code from the dbc file was generated using the python script provided by the Professor which was embedded in the eclipse package. During the course of extensive testing, we found out couple of bugs in the python script which were needed to be solved.
The first bug was that the python script did not allow us to use the "double" data type. The float works fine for decimal digits, but while testing we figured out that the floating point variables are not accurate upto 6 digits after the decimal points. The GPS coordinates needs accuracy till 6 digits after the decimal points or else the it creates a huge problem for navigation. So we made a change to the following function in the python script to include the "double" datatype.
def get_code_var_type(self):
      if self.scale_str.count(".00000")>=1:
          return "double"
      elif '.' in self.scale_str:
          return "float"
      else:
          if not is_empty(self.enum_info):
              return self.name + "_E"
          _max = (2 ** self.bit_size) * self.scale
          if self.is_real_signed():
              _max *= 2
          t = "uint32_t"
          if _max <= 256:
              t = "uint8_t"
          elif _max <= 65536:
              t = "uint16_t"
          # If the signal is signed, or the offset is negative, remove "u" to use "int" type.
          if self.is_real_signed() or self.offset < 0:
              t = t[1:]
          return t
The second bug was that the python script detects MIA for a node once, but if that node comes out of the MIA, the local board doesn't detect that. So if a node went to MIA and it was detected by the local node, even if the MIA-ed node comes back on the bus, the local node never detects it unless we reset the board. So we made the changes to following function to incorporate that:
def _get_mia_func_body(self, msg_name):
       code =
       code += ("{\n")
       code += ("    bool mia_occurred = false;\n")
       code += ("    const dbc_mia_info_t old_mia = msg->mia_info;\n")
       code += ("    msg->mia_info.is_mia = (msg->mia_info.mia_counter_ms >= " + msg_name + "__MIA_MS);\n")
       code += ("\n")
       code += ("    if (!msg->mia_info.is_mia) { // Not MIA yet, so keep incrementing the MIA counter\n")
       code += ("        msg->mia_info.mia_counter_ms += time_incr_ms;\n")
       code += ("    }\n")
       code += ("    else if(!old_mia.is_mia)   { // Previously not MIA, but it is MIA now\n")
       code += ("        // Copy MIA struct, then re-write the MIA counter and is_mia that is overwriten\n")
       code += ("        *msg = " + msg_name + "__MIA_MSG;\n")
       code += ("        msg->mia_info.mia_counter_ms = 0;\n")
       code += ("        msg->mia_info.is_mia = true;\n")
       code += ("        mia_occurred = true;\n")
       code += ("    }\n")
       code += ("\n    return mia_occurred;\n")
       code += ("}\n")
       return code
CAN bus design
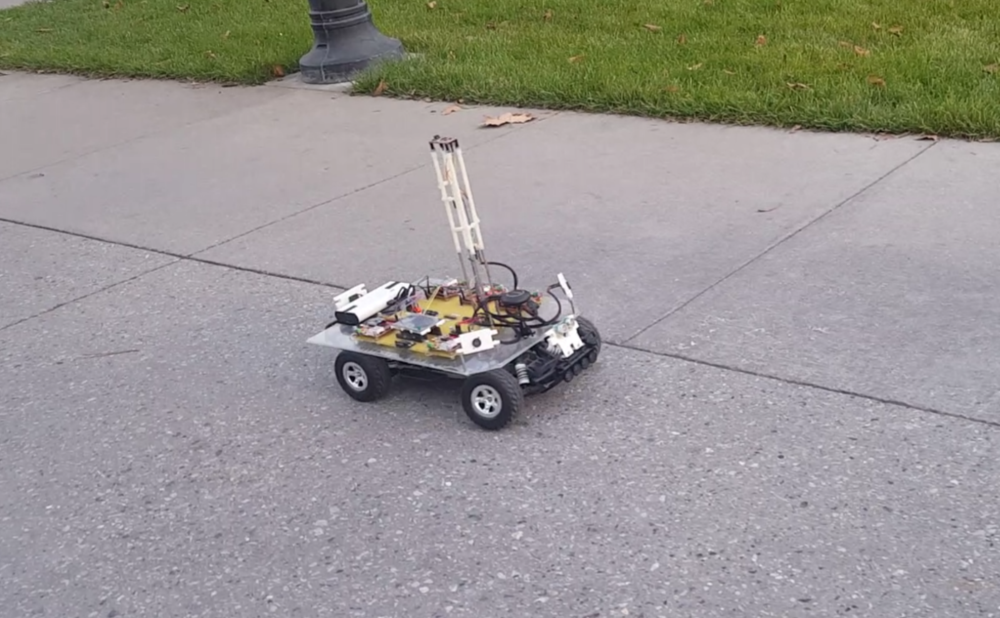
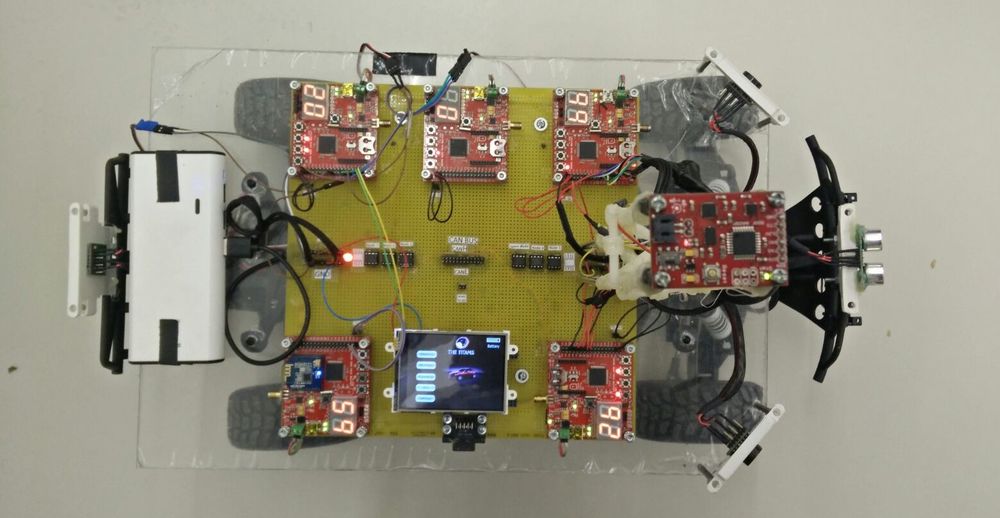
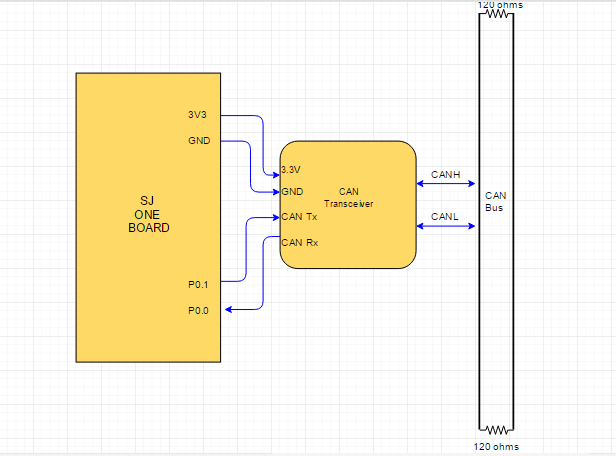
All the nodes communicate via the CAN bus. As can be seen from the picture of the car, the bus runs in the middle of the board and all nodes are connected to the bus via CAN tranceivers. There is an 6th CAN tranceivers and extra CAN-H and CAN-L pins on the board for an optional node interface for debugging purpose.
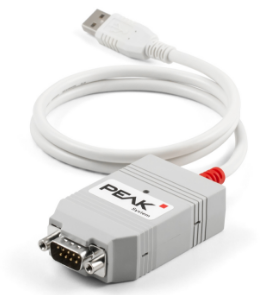
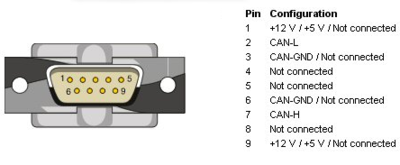
PCAN interface
The DB9 connected is interfaced to the CAN bus as shown in the below pin diagram. This interface enables the monitoring of the CAN bus through a tool called Bus master. The CAN bus communicates to the bus master tool via the DB9 connector and PCAN dongle.
More information on bus master can be found here:http://www.socialledge.com/sjsu/index.php?title=Industrial_Application_using_CAN_Bus#BusMaster_Tutorial
This is a powerful debugging tool, where real time CAN messages can be monitored. The signals can be plotted in real time, which enables us to see how a signal changes under different circumstances. This tool played a crucial role in narrowing down the bugs in the design.
DBC File Implementation
The DBC File is a description of behavior of Controller Area Network (CAN) bus. Basically, it contains information about number of nodes attached on the bus and how they communicate with each other. DBC file defines the format of all the messages that are transmitted over CAN bus, which contains message id, source and destination of message, length of the message, data types for the different data field and minimum and maximum value the data field can take.
- The following is the table that depicts ECUs and their message ids. The most critical node is given higher priority.
| Message Id | ECU |
|---|---|
| 0x10 | Sensor |
| 0x20 | Master |
| 0x30 | Motor |
| 0x40 | GPS and Compass |
| 0x50 | App and Bluetooth |
- The following is the DBC file of the project.
VERSION ""
NS_ :
       BA_
       BA_DEF_
       BA_DEF_DEF_
       BA_DEF_DEF_REL_
       BA_DEF_REL_
       BA_DEF_SGTYPE_
       BA_REL_
       BA_SGTYPE_
       BO_TX_BU_
       BU_BO_REL_
       BU_EV_REL_
       BU_SG_REL_
       CAT_
       CAT_DEF_
       CM_
       ENVVAR_DATA_
       EV_DATA_
       FILTER
       NS_DESC_
       SGTYPE_
       SGTYPE_VAL_
       SG_MUL_VAL_
       SIGTYPE_VALTYPE_
       SIG_GROUP_
       SIG_TYPE_REF_
       SIG_VALTYPE_
       VAL_
       VAL_TABLE_
BS_:
BU_: DBG MASTER GPS MOTOR SENSOR APP
BO_ 1 APP_START_STOP: 8 APP
 SG_ APP_START_STOP_cmd : 0|1@1+ (1,0) [0|0] "COMMAND" MASTER
 SG_ APP_ROUTE_latitude : 1|28@1+ (0.000001,-90.000000) [-90|90] "" MASTER
 SG_ APP_ROUTE_longitude : 29|29@1+ (0.000001,-180.000000) [-180|180] "" MASTER
 SG_ APP_FINAL_COORDINATE : 58|1@1+ (1,0) [0|0] "" MASTER
 SG_ APP_COORDINATE_READY : 59|1@1+ (1,0) [0|0] "" MASTER
BO_ 16 SENSOR_DATA: 4 SENSOR
 SG_ SENSOR_left_sensor : 0|8@1+ (1,0) [0|0] "Inches" MASTER,APP,MOTOR
 SG_ SENSOR_middle_sensor : 8|8@1+ (1,0) [0|0] "Inches" MASTER,APP,MOTOR
 SG_ SENSOR_right_sensor : 16|8@1+ (1,0) [0|0] "Inches" MASTER,APP,MOTOR
 SG_ SENSOR_back_sensor : 24|8@1+ (1,0) [0|0] "Inches" MASTER,APP,MOTOR
BO_ 32 MASTER_HB: 8 MASTER
 SG_ MASTER_SPEED_cmd : 0|3@1+ (1,0) [0|0] "" SENSOR,MOTOR,GPS,APP
 SG_ MASTER_STEER_cmd : 3|3@1+ (1,0) [0|0] "" SENSOR,MOTOR,GPS,APP
 SG_ MASTER_LAT_cmd : 6|28@1+ (0.000001,-90.000000) [-90|90] "" SENSOR,MOTOR,GPS,APP
 SG_ MASTER_LONG_cmd : 34|29@1+ (0.000001,-180.000000) [-180|180] "" SENSOR,MOTOR,GPS,APP
 SG_ MASTER_START_COORD : 63|1@1+ (1,0) [0|0] "" SENSOR,MOTOR,GPS,APP
BO_ 33 MASTER_ROUTE_DONE: 1 MASTER
 SG_ MASTER_DONE_cmd : 0|8@1+ (1,0) [0|0] "" MOTOR,APP
BO_ 65 GPS_Data: 8 GPS
 SG_ GPS_READOUT_valid_bit : 0|1@1+ (1,0) [0|1] "" MASTER,MOTOR,APP
 SG_ GPS_READOUT_read_counter : 1|6@1+ (1,0) [0|60] "" MASTER,MOTOR,APP
 SG_ GPS_READOUT_latitude : 7|28@1+ (0.000001,-90.000000) [-90|90] "" MASTER,MOTOR,APP
 SG_ GPS_READOUT_longitude : 35|29@1+ (0.000001,-180.000000) [-180|180] "" MASTER,MOTOR,APP
BO_ 66 COMPASS_Data: 2 GPS
 SG_ COMPASS_Heading : 0|9@1+ (1,0) [0|0] "DEGREE" MASTER,APP,MOTOR
BO_ 67 GEO_Header: 3 GPS
 SG_ GPS_ANGLE_degree : 0|12@1+ (0.1,-180) [-180.0|180.0] "Degree" MASTER,MOTOR,APP
 SG_ GPS_DISTANCE_meter : 12|12@1+ (0.1,0) [0.0|400.0] "Meters" MASTER,MOTOR,APP
BO_ 48 MOTOR_STATUS: 2 MOTOR
 SG_ MOTOR_STATUS_speed_mph : 0|16@1+ (0.001,0) [0|0] "mph" MASTER,APP
CM_ BU_ MASTER "The master controller driving the car";
CM_ BU_ MOTOR "The motor controller of the car";
CM_ BU_ SENSOR "The sensor controller of the car";
CM_ BU_ APP "The communication bridge controller of car";
CM_ BU_ GPS "GPS and compass controller of the car";
CM_ BO_ 100 "Sync message used to synchronize the controllers";
BA_DEF_ "BusType" STRING ;
BA_DEF_ BO_ "GenMsgCycleTime" INT 0 0;
BA_DEF_ SG_ "FieldType" STRING ;
BA_DEF_DEF_ "BusType" "CAN";
BA_DEF_DEF_ "FieldType" "";
BA_DEF_DEF_ "GenMsgCycleTime" 0;
BA_ "GenMsgCycleTime" BO_ 32 100;
BA_ "GenMsgCycleTime" BO_ 16 100;
BA_ "GenMsgCycleTime" BO_ 48 100;
BA_ "GenMsgCycleTime" BO_ 65 100;
BA_ "GenMsgCycleTime" BO_ 66 100;
Sensor Controller
Design & Implementation
The main purpose of the sensor controller is Obstacle avoidance and one of the straight forward way to achieve the goal is to use an Ultrasonic sensor.
Sensor controller being the “eye” of the project, lot of thoughts were put into deciding the right sensor to serve the purpose of obstacle avoidance. Considering the factors of reliability and cost, Maxbotix EZ0 ultrasonic sensor is chosen to be left and right sensors. EZ ‘0’ model is selected because it has the widest beam coverage of all the Maxbotix EZ series sensor models. Devantech SF05 ultrasonic sensor is selected for the middle sensor. A different model is used for middle sensor because of its different frequency, which avoids interference between sensors.
The sensors are mounted and tested at different angles so that the front three sensors cover a wide area, without leaving any dead or uncovered region.
Hardware Design
The sensors are interfaced using Port 2 GPIO pins of the microcontroller. The sensors require 5V power supply, which was provided from the main board’s supply. The trigger input to the sensors and the PWM output are interfaced to the GPIO pins as shown below in table. The pins for each sensor are chosen in such a way that it would not tangle each other while physically connecting them on the main board. CAN 1 of the SJOne board is connected to the CAN bus of the car which is also shown in the table below.
| Pin Name | Function |
|---|---|
| P2_0 | Trigger for left sensor |
| P2_1 | Echo for left sensor |
| P2_2 | Trigger for middle sensor |
| P2_3 | Echo for middle sensor |
| P2_4 | Trigger for right sensor |
| P2_5 | Echo for right sensor |
| P0_1 | CAN Tx |
| P0_2 | CAN Rx |
3D Printing Design
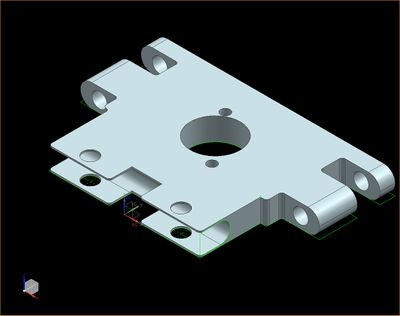
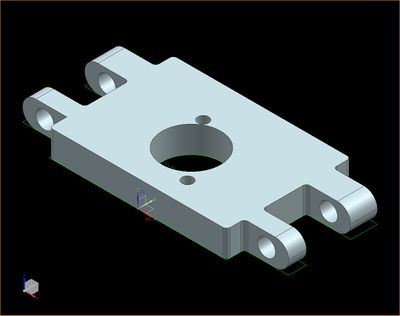
Sensors are required to be placed at a minimum height of 18 cm from the ground and at a tilt of 5 degrees to avoid ground reflections. A proper mount is required to place them at adjustable angles and heights. Hence the mounts are 3D printed using the below 3D deigns. The heights are adjustable by adding mode standoffs and the angle is adjustable by using the bottom screws.
Design reference: F14: Self Driving Undergrad Team
Hardware Interface
The sensors are interfaced using GPIO pins. CAN 1 of the sensor controller is interfaced to the CAN bus of the car. Below diagram shows the hardware interface between the micro controller, sensors and the CAN bus. Note: If Maxbotix EZ series is used, makes sure the intended model is what got shipped. The black dot represent 'EZ0' model. Do not mix up the models unless you know what you are doing.
Software Design
Software is designed such that the no two sensors of same type/model close by will be triggered simultaneously, so as to avoid interference with each other. Since the left and right sensor are of the same model, they are triggered sequentially, every 50 ms. The Maxbotix sensors cannot be triggered faster than 49 ms because it takes the sensors a maximum of 49 ms to pull down the PWN pin low when there is no obstacle for 6 meters or 254 inches. If triggered sooner, the reflected waves from the sensor will interfere with the next sensor, giving unpredictable values. The middle sensor and the back sensor are triggered every 50 ms. Hence we get all 4 sensor readings in 100 ms. The triggering of sensors is handled in 1 ms task, but with the check to trigger only every 50 ms. Refer the below datasheets for timing information for triggering and detailed working of both sensor models.
Maxbotix EZ0: http://www.maxbotix.com/documents/LV-MaxSonar-EZ_Datasheet.pdf
Devantech SF05:https://www.robot-electronics.co.uk/htm/srf05tech.htm
Implementation
Algorithm
1. Initialize the trigger pins as output and PWM pins as input
2. Configure the PWM pins for falling edge interrupt
3. Trigger left and middle and back sensor and start the timer for all three
4. Wait for echo from all of them
5. When echo is received, calculate the distance in inches using the below formula
Distance = (stop time – start time)/147
6. Trigger right and middle sensor and start the timer for both & repeat from step 4
7. Broadcast the sensor values on CAN bus
Below is the sample interrupt callback function(ISR) to calculate the distance of obstacle.
The flowcharts shown describes in detail on how each sensor is triggered and broadcasted over CAN every 100 ms.
Filters
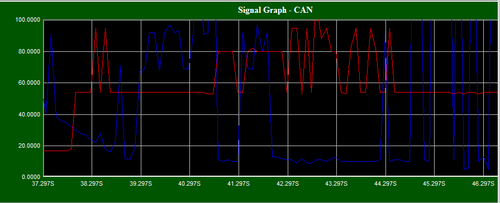
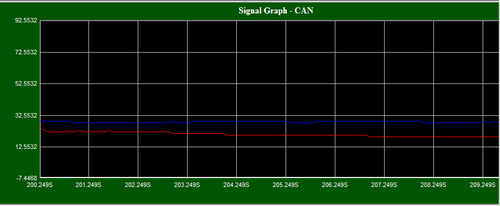
Filtering is an important step in removing unwanted glitches in the sensor readings. Mode filtering is deployed to all 4 sensor readings. Below is the plot of sensor readings with and without filters in an extreme scenario where there are many moving objects at different distances
Testing & Technical Challenges
1. Read the datasheet of sensors in detail before ordering them. Instead going with same model for all 4 sensors, a different model with a different frequency can be used, so that you can trigger them at the same time without any interference.
2. The behavior of sensors in corridors with hard, flat surfaces like walls and outdoors are totally different. Plan ahead to calibrate and optimize the sensor for both indoors and outdoors.
3. Read the datasheet to know the requirements during power ON. Each time the LV-MaxSonar-EZ is powered up, it will calibrate during its first read cycle. The sensor uses this stored information to range a close object. For Maxbotix EZ0, there should not be any obstacle in front of the sensors for at least 14 inches, otherwise sensor's calibration will not be reliable. If an object is too close during the calibration cycle, the sensor may ignore objects at that distance.
4. Make use of PCAN dongle and BusMaster software to plot the sensor reading real time. This will give a good idea on the filter requirements.
5. Make use of LCD to display the sensor readings when car is on the move. This will help in locating the areas where the sensor behaves unexpectedly. Once located, PCAN and Busmaster can be used to pin point the issues.
6. The ultrasonic sensors are limited in their abilities. Because of the peculiar nature of ultrasonic waves, ultrasonic sensors require that a target be on
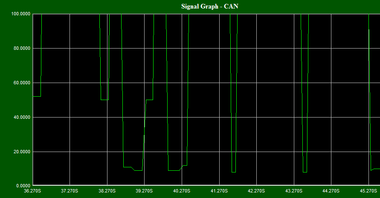
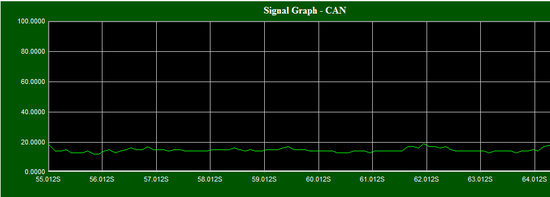
axis and the readings will be unreliable when the target is at an angle to the sensor, especially when the target is a hard, flat surface like a wall. Consider different sensors like LIDAR. Below graphs show how the sensor readings were fluctuating when the sensor is at an angle to the wall.
Motor & I/O Controller
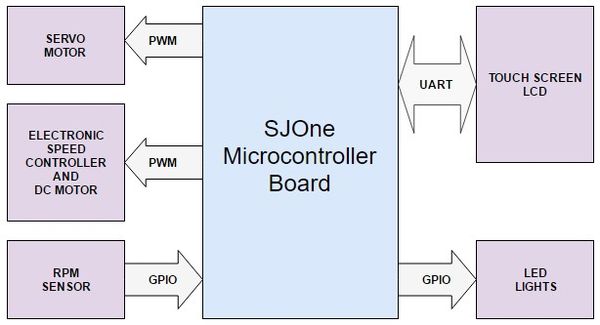
Motor and I/O controller is one of the five controller in the autonomous car. It is responsible for car's steering, movement, input commands and to display critical information regarding the car. The controller is connected to different hardware modules that take care of the mentioned features. These modules comprise of servo motor which is used for steering, electronic speed controller for controlling the DC motor which in turn controls the movements of the car and a touch-screen LCD display for data input and to display critical information. These modules are explained in further detail in hardware interface section of the Motor & I/O Controller below.
Design & Implementation
To design the motor controller to control servo and dc motor, research on required duty cycle was done. The dc motor can rotate with different speed based on the duty of the PWM signal. For our design we have three different speeds at which the car can move forward. In addition to the forward movement of the car we also have a reverse movement. All of these speeds in forward and backward direction require different PWM duty cycle. Based on this analysis, research of specific duty cycle required for each speed level was done using an oscilloscope. Similarly, for steering control different duty cycle is required to position the wheel in certain direction. Since we have five different wheel positions , we required five different duty cycle to perform these position control.
Furthermore, research on speed sensor was done using oscilloscope to find the behavior of signal that the sensor generates. By probing the signal wire on the speed sensor we found out that with every revolution the sensor sends out a pulse in the signal wire. Based on this analysis we designed an interrupt based pulse reader that tells exactly how many rotation the wheel took within a minute. Using this data we calculate our actual car speed.
Hardware Design
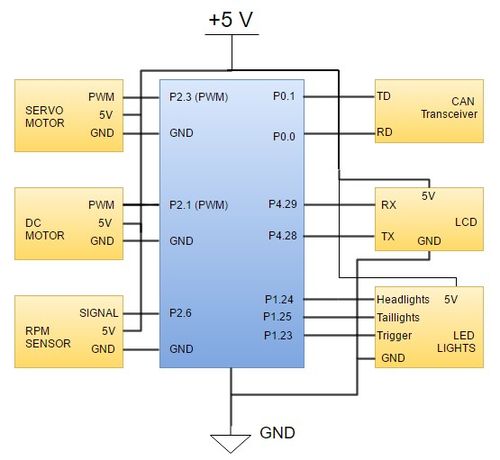
The motor and I/O controller hardware design consists of SJOne microcontroller board connected to servo motor, electronics speed control, LCD module and LED lights. Servo motor and electronics speed control are connected to the microcontroller using PWM signal. The touch screen LCD is connected to the microcontroller board using UART interface. The LED lights are connected to the board using GPIO interface. The electronic speed controller is powered using the 6v power supply from the car battery pack. The servo motor for steering control is power on using 5V from the power bank. The touch screen LCD module is also powered on using the 5V using the power bank.
Hardware Interface
Electronic Speed Controller (ESC)
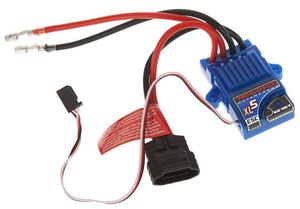
The Electronic Speed Controller is a component used for feeding PWM signal to a DC motor to control the speed at which it rotates. In addition to the speed it also controls the direction in which the motor rotates. These features help the car move forward and reverse and do these in different speeds. From the diagram below you can see the ESC has three color coded wires that are used for PWM signal(WHITE Color), VCC(RED Color) and GND(BLACK Color). These three color coded wires connect to the SJOne micro-controller board and power bank used in the car. There are also two wires coded red and black that have wire adapter at the end connect to the battery pack. The other two red and black wire connect directly to the DC Motor. The ESC also has a EZ Set button to switch between different speed modes, calibrate the speed and steering, and most important of all switch on the ESC itself. Please refer to the documentation provided by TRAXXAS for using the ESC.
| S.No | Wires on (ESC) | Description | Wire Color Code |
|---|---|---|---|
| 1. | (+)ve | Connects to DC Motor (+)ve | RED |
| 2. | (-)ve | Connects to DC Motor (-)ve | BLACK |
| 3. | (+)ve | Connects to (+)ve of Battery | RED |
| 4. | (-)ve | Connects to (-)ve of Battery | BLACK |
| 5. | P2.1 (PWM2) | PWM Signal From SJOne | WHITE |
| 6. | NC | NC | RED |
| 7. | (-)ve | Negetive terminal | BLACK |
DC Motor
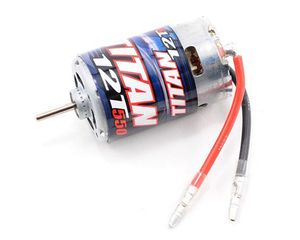
The DC motor is the primary component that controls the rotation of the car wheel. Based on the direction of the current flow to the motor it rotates the wheel in forward or backward direction. Also, based on the amount of current flow to the motor, it controls the speed at which the wheels rotate. In the figure below you can see the DC motor has two wire, red and black for (+)ve and (-)ve connection respectively. For forward movement of the wheels the current flows from (+)ve to (-)ve. For reverse movement the current flows from (-)ve and (+)ve. For controlling the speed of the wheel the motor is fed with different amount of current from the ESC, which is controlled based on the duty cycle fed to ESC.
| S.No | Wires on (ESC) | Description | Wire Color Code |
|---|---|---|---|
| 1. | (+)ve | Positive Terminal | RED |
| 2. | (-)ve | Negetive terminal | BLACK |
Servo Motor
The servo motor is the component responsible for the steering of the car. The servo motor is controlled directly from the SJOne micro-controller board. It has three color coded wire white, red and black which are used for PWM signal, 5 Volts and GND respectively. Based on the duty cycle of the signal sent to the servo, it rotates in left/right direction. The PWM signal fed to the servo motor is of frequency 100Hz. Detailed duty cycle values and corresponding steering position are provided in the software design section.
| S.No | Pin No. (SJOne Board) | Function | Wire Color Code |
|---|---|---|---|
| 1. | P2.3 (PWM4) | PWM Signal | WHITE |
| 2. | VCC | 5 Volts | RED |
| 3. | GND | 0 volts | BLACK |
Speed Sensor
The speed sensor is one of the hardware component used in the autonomous car for sensing the speed of the car and feeding the information to SJOne microcontroller. The sensor is installed in the gear compartment of the Traxxas car along with the magnet trigger. When the magnet attached to the spur gear rotates along with the gear it passes the hall-effect RPM sensor after every revolution. As soon as the magnet comes in front of the sensor the sensor sends a pulse on the signal line which is color coded as white. The other color coded wires red and black are used for VCC and GND to power the sensor. The sensor is powered using the 5 volts power supply from the power bank.
| S.No | Pin No. (SJOne Board) | Function | Wire Color Code |
|---|---|---|---|
| 1. | P2.6 | GPIO (INPUT) | WHITE |
| 2. | VCC | 5 Volts | RED |
| 3. | GND | 0 volts | BLACK |
IO module
IO module consists of touch LCD for displaying critical information, head lights, brake lights and running lights. The LCD is interfaced to UART3 of the micro controller. The lights are interfaced via the GPIO pins.
The below figure shows how data from different nodes get to the LCD via CAN bus. It also shows how configurations done via LCD touch screen get to all other nodes via CAN bus. All nodes broadcast data on CAN bus. Motor node rceives, converts it into LCD format and displays on LCD. When a touch signal is received via LCD, the motor node receives it and broadcast the data to other nodes. Rest of the nodes change their configurations when message from LCD is received.
Software Design
Motor Controller
Software design for the motor controller consist of different software modules that control speed, steering, inputs and outputs interface using touch screen LCD, and sensing the speed of the car. Controlling speed, steering and sensing speed is done using 10Hz periodic loop. On the other hand the code for LCD input and output run as a task that get scheduled in between the 10Hz periodic scheduler.
The second phase of the motor controlling is maintaining a constant speed i,e., to find out the speed at which it is running and control the car based on the speed at which it is traveling. This comes in handy when the car has a destination that goes uphill. This operation can be called as speed controlling. This operation is done with the help of a speed sensor that can be fixed either on to the wheel or on to the transmission box of the car.
DC Motor and Servo Motor
Software design for the speed control and steering control is done using 5Hz and 10Hz periodic loop respectively. The periodic loop consists of two switch cases, one switch case for speed control and another one for steering control. For speed control, switch cases are for stop, 'slow' speed, 'medium' speed, 'fast' speed, and reverse. For steering control, the switch cases are for the positions of the wheel that are 'hard' left, 'slight' left, center, 'slight' right and 'hard' right. After the CAN message for speed and steering are decoded, the values are fed into switch cases for speed and steering control. Based on the values of the steering and speed sent by the master, motor controller takes action. Below flowchart are for steering control and speed control, which shows a command being received from master which is then used in a switch case to choose between different steering positions and speeds. The provided gif here shows change in five steering positions and their respective PWM duty cycle applied to the servo motor. The macro defined for the duty cycle below are percentage of the duty cyle for PWM signal applied to the servo. For our design these are X percentage of 100Hz, which is the frequency of the PWM signal used to control the servo motor.
    #define STEERING_POS_LEFT			10
    #define STEERING_POS_SLIGHT_LEFT		12
    #define STEERING_POS_CENTER		        14
    #define STEERING_POS_SLIGHT_RIGHT		16
    #define STEERING_POS_RIGHT			18
RPM Sensor
The RPM sensor code calculates the revolution of the spur gear every 200 ms. It calculates the revolution based on the interrupt signal generated on the GPIO pin connected to the SJOne board. The function for calculating the number of revolution is called from inside the switch case for slow speed shown in the speed control flowchart. The formula used to calculate mph is shown below.
Formula used for calculating mph:
    mph = 5 * (((2 * PI * WHEEL_RADIUS) * no_of_revolution * SECS_PER_HOUR) / (CENTIMETERS_PER_MILES * FINAL_DRIVE));
    NOTE: Multiplier value 5 is used to convert calculation of no_of_revolution every 200 ms to 1 second which depends on the periodic loop the
          above code is running in.
Macros used for above parameter are given below:
    #define     FINAL_DRIVE              12.58	         //Gear to Wheel Ratio: Wheel rotates 1x for every 12.58 revolution of the DC motor
    #define     PI			  3.14159
    #define     WHEEL_RADIUS		  2.794		 //Unit is centimeters
    #define     SECS_PER_HOUR		  3600
    #define     CENTIMETERS_PER_MILES	  160934.4
Other than providing the speed at which the car is moving, the RPM sensor has another critical functionality which is the speed control. For constant speed control we have implemented a Proportional and Integral (PI) controller that takes care of speed control up and down any slope which would otherwise be variable due to gravity. Based on the output from the PI controller, the PWM duty cycle is added to the duty cycle already provided for slow speed. If the actual speed calculated using the RPM sensor is less than the set speed (slow speed),case during uphill, the error is positive. So in this case the PI controller increments the the duty cycle to reach the set speed. On the other hand when the actual speed is more than that of the set speed,which is the case during downhill, the error is negative so the PI controller tries to decrease the duty cycle in order to reduce the speed down to the set speed. Although, our actual PI controller code contains lot of filters to confine speed within safe limits , snippet for basic PI controller is provided below to show the flow of calculation for proportional and integral values for speed control.
    error = set_speed - pi_mph;                                   //Error between set speed and the actual speed of the car
    p_controller = Kp * error;                                    //Calculation of the proportional value based on the errors
    i_controller = Ki * speed_error_sum;                          //Calculation of the integral value based on the sum of previous error
    speed_error_sum  = speed_error_sum + error;                   //Calculation of sum of previous errors
    duty_cycle = p_controller + i_controller;                     //Controller output based on integral and proportional value
IO module
Since motor's functional information is critical, the LCD uses UART as a communication medium to transmit messages. The LCD and lights working in the software is
designed as low priority tasks running at 500 ms. Even though UART takes a long time to process, it will not clog the periodic tasks.
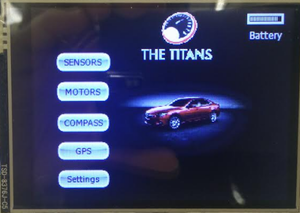
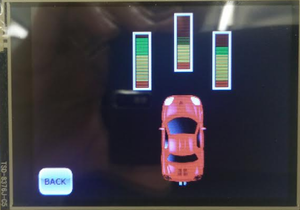
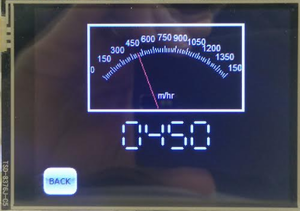
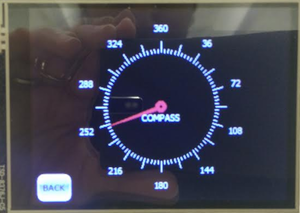
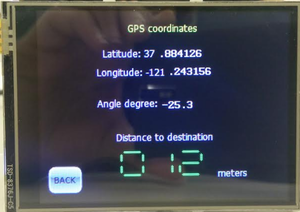
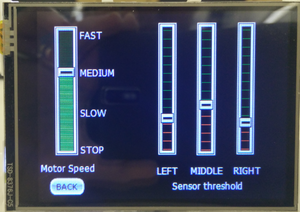
The LCD is interfaced early in the project since it aids in debugging while the car is on the move. Critical information such as sensor readings, motor speed, compass direction, GPS coordinates, the degree to turn and distance to the destination are displayed on the LCD. The below screens show the information displayed on the LCD.
There is also a Settings menu through which the motor speed and sensor thresholds can be configured without having to re-build and re-flash the software.
Implementation
IO module algorithm
The critical data is received from different nodes via CAN and packed into packets and sent to the LCD via UART. The LCD used requires a specific format of data from the micro controller for it to display the data.Refer the below datasheet for information on the packet format for 4D systems uLCD-32PTU.
Datasheet: http://www.4dsystems.com.au/productpages/uLCD-32PTU/downloads/uLCD-32PTU_datasheet_R_2_0.pdf
User manual: http://www.4dsystems.com.au/productpages/PICASO/downloads/PICASO_serialcmdmanual_R_1_20.pdf
The below flowchart explains how the tasks work in order to transmit and receive data from the LCD.
LCD screens
Testing & Technical Challenges
One of the challenges we faced while designing our motor controller was to keep the speed calibration of the car in place. We noticed that the speed calibration of the electronic speed controller (ECS) went out of calibration very often. The reason for this was excessive switching on and off of the ESC during the testing phase, which is not designed to do so. Also, all function control from the ESC was done using one single button. Based on how many times you press the button and for how long you press the button, different mode change are directed. We found this tricky since overshooting the button press duration would configure the ESC to a complete different mode. Considering the fact that the ESC was not designed to be switched on and off excessively, we had to live with it and tried to keep the battery pack connected to the ESC and kept it switched on throughout the duration of our testing. We also kept the remote controller handy to calibrate the ECS whenever required.
Geographical Controller
Design & Implementation
Geo Node's sole purpose is to provide the heading error angle and distance to checkpoint/destination to the Master Node. To be able to achieve this, the Geo Node requires gathering of current GEO data and computing them to come up with what Master Node needs. The two required GEO data are current GPS coordinates and compass heading angle. Once these are gathered, Geo Node has to calculate the bearing angle which is the angle between two locations in respect to north. Using both bearing and compass heading angles, the heading error angle can be calculated. For calculating the distance, it requires two GPS coordinates and a little bit of math.
Bearing Angle Calculation
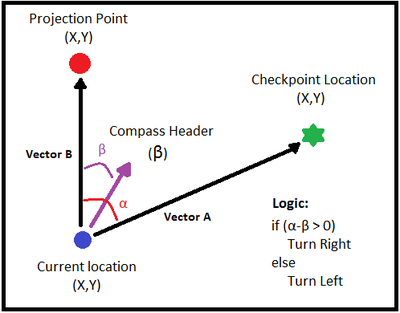
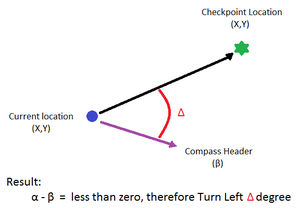
The idea to calculate bearing angle is very basic and fundamental. Since we will be using an RC car and running it on the ground, we'll only be dealing with latitude and longitude coordinates. In another word, positioning can be calculated on a 2D plane using X & Y coordinates, longitude and latitude coordinates respectively. Yes, the earth is not flat, but spherical and that must be accounted for when making calculations but since we making calculations on such a minute scale and short distance, in the tens of meters only, spherical impact can be negated. Imperfection on the pavement would probably make more impact than the earth's spherical shape at this scale. With all that being said, our method to calculate the bearing angle is shown in the image below.
To calculate the bearing angle, two GPS coordinates are required. One being the current GPS coordinates and the other is the checkpoint location provided by Master Node. Since we want to calculate the bearing angle in respect to north, we project a 3rd point to north using the current GPS coordinates. Now that we have three coordinates, we can calculate vector A (Current location to Checkpoint location) and vector B (Current location to Projection location). Once we calculated both vectors, we use the following equation to calculate the bearing angle:
Angle between two vectors:
cos α = (vector_A * vector_B) / (│vector_A│ * │vector_B│), where α is the bearing angle
Once the bearing angle has been calculated, the heading error angle can now be calculated. Heading error angle is simply the bearing angle (α) minus the compass angle (ß). Refer to above image.
Heading Error = α - ß
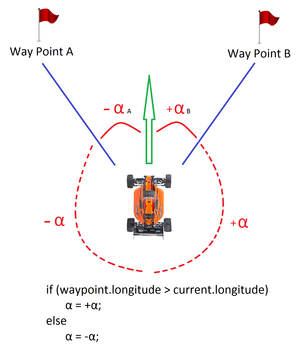
The heading error will dictate whether the car need to keep left or keep right to reach the checkpoint. For our implementation, whenever the heading error is positive, the cars needs to keep right and whenever heading error is negative, it keeps right.
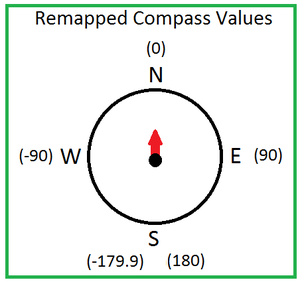
It is important to normalize both bearing angle and compass angle prior to calculating the heading error. Both bearing and compass angles had to be mapped to have their values range from -180° to 180° as shown in the images below.
Distance Calculation
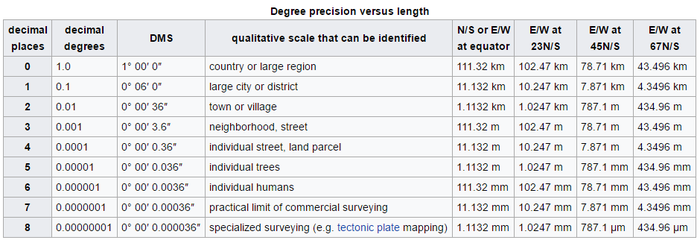
To calculate the distance between any two GPS coordinate on a 2D plane, the first step is to calculate the magnitude of both points. The magnitude will yield the distance between both points in decimal degree. Because the coordinates are measured in decimal degrees having a precision point of up to 6 decimal points, e.g. 37.123456, we have to first know how long in meters does 0.000001 decimal degree equates to. Also, since the earth is spherical, the ratio of 0.0000001 decimal degree to meters will change depending on where you are on the latitude axis. For example, on the equator where latitude is 0.0 decimal degree, the ratio of meters to 0.000001 decimal degree to will be the highest at 111.32mm compared to 78.71mm at latitude 45.0 decimal degree.
Referencing Wikipedia table below, we get a couple reference points of how long 0.000001 decimal degree equates to in millimeters.
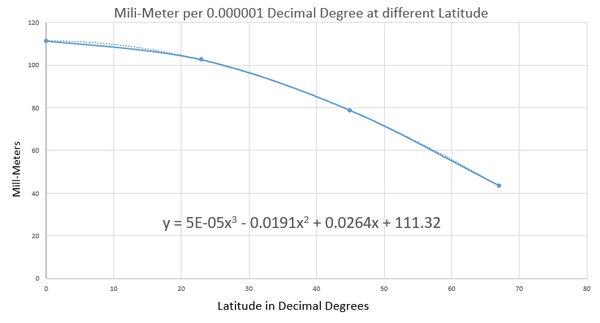
Using these reference points we can plot them and generate a polynomial equation to calculate the ratio between 0.000001 decimal degrees to meter (or millimeter per the chart). We get the following chart and equation from it:
In the program, it would be written as:
#define meterPerDecimalDegree(latitude) ((0.00005*pow(latitude,3) - 0.01912*pow(latitude,2) + 0.02642*latitude + 111.32)*0.001), plotting in the current latitude would yield Meter per 0.000001 decimal degrees
After implementing both these bearing and distance calculation into our project, they proved to be accurate computation in guiding our autonomous car to its destination. Of course although implementing our own Geo calculation method was fun and exciting to see it work in real time application, it is worth mentioning that there are plenty of other methods of Geo computation out there. A popular and quick method would be the Haversine formula. Google has plenty of resources about it.
Hardware Design
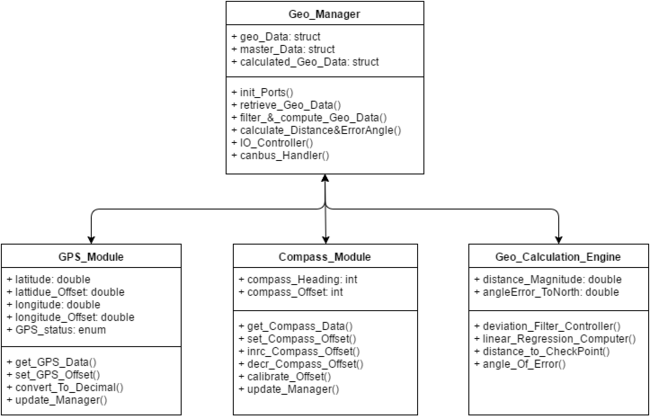
- Below figure represents the block diagram of Geo Controller. Geo-controller consist of GPS module and IMU module. GPS module is responsible for providing the GPS coordinates and IMU module is responsible for providing Current compass heading with respect to north. IMU and GPS module is interfaced to the SJSU One board via Uart3 and Uart2 respectively.
- Below table shows the Pins connection of IMU module with SJ One Board. Module is interfaced with SJSU One Controller via UART3 interface. The operating volatge of IMU module is 3.3v.
| S.R. | IMU Module Pins | SJOne Board Pins |
|---|---|---|
| 1 | Vin | 3.3v |
| 2 | GND | GND |
| 3 | TX | P4.29 (RXD3) |
| 4 | RX | P4.28 (TXD3) |
- Below table shows the Pins connection of GPS module with SJ One Board. Module is interfaced with SJSU One Controller via UART2 interface. The operating volatge of GPS module is 3.3v.
| S.R. | GPS Module Pins | SJOne Board Pins |
|---|---|---|
| 1 | Vin | 3.3v |
| 2 | GND | GND |
| 3 | TX | P2.9 (RXD2) |
| 4 | RX | P2.8 (TXD2) |
Hardware Interface
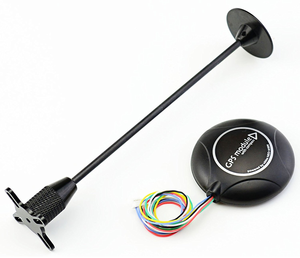
GPS Module: Readytosky Ublox NEO-M8N GPS Module
This GPS module uses UART serial communication interface. The refresh rate ranges from 1Hz up to 18Hz with a default baud rate of 9600bps. To achieve the desired refresh rate of 10Hz for our design, the baud rate had to be increased to 115200bps to accommodate for the demanded bandwidth from 10Hz refresh rate.
Specifications & Documentation: www.u-blox.com
GPS Connector Definition:
- GND,
- TX,data output
- RX,data intput
- VCC,2.7V-3.6V
Why choose u-blox GPS module?
There are several reasons to select this GPS module oppose to other types such as Sparkfun's popular Venus GPS. First, is the price. The u-blox GPS module can be purchased off amazon for about $35 with integrated antenna compared to the Venus for $50 with an additional ~$10-15 for the required external antenna. This brings up the next point and that has to do with the external antenna. Since the antenna's coaxial cable can range between 10 to 15 feet, it becomes a hassle trying to tuck it away on once GPS module is mounted on the RC car. Second point is the accuracy. The u-blox's data sheet claims have an accuracy of about 2 meters (Amazon.com seller claims 0.6 to 0.9 meter) compared to 2.5 meters on the Venus. Although these different GPS modules uses their own software to configure its settings, they all are identically configurable. This means it is a no-brainer to go for the u-blox GPS module.
Setting up u-blox GPS module:
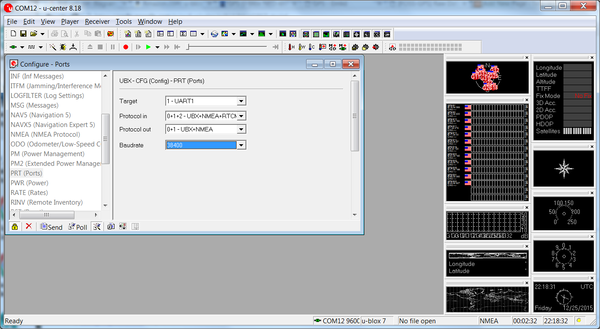
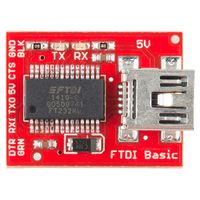
To be able to use u-blox center software to configure the GPS module, either u-blox's developer kit can be purchased or a cheaper alternative choice would be to purchase a FTDI USB to Serial adapter module for about $5 from any convenient online retailer. The u-blox software can be downloaded free from u-blox's website. Once connection is establish between the GPS module and computer, the software provides great number of configurations to change and also a wide GPS map tools to play with. Despite all the fun features the software provides, there are a few important settings that needed to be changed to fit our design.
On default, the refresh rate is set at 1000ms, or 1Hz. This had to be changed to 100ms to be able to get a refresh rate of 10Hz. Next, for the best accuracy possible from this GPS, Navigation Mode needs to be changed to "Pedestrian". This settings ensure best accuracy below speed of 30 meters/second which our RC car is well under. Lastly, since we are only interested in GPRMC messages from our GPS module, u-blox software provided option to turn off all messages except for GPRMC. This helps tremendously when trying to capture reliable messages.
The Readytosky GPS module has a soldered-on little super capacitor that charges up once power is provided and then acts as a battery once power is removed. Although this super capacitor helps by providing power to the memory to keep GSP configuration settings saved as well as provide a warm or hot start (faster to acquire accurate GPS data), it was only able to power for a few hours after power is removed. Although the datasheet says the memory is flash, it kept resetting back to default once battery power is gone. This meant configuration settings had to be redone often. To remedy this problem, the super capacitor had to be removed and in its place, a 3.3V coin battery soldered on.
Interfacing with SJ-One Board:
Interfacing this GPS module to the SJ-One board was straight forward. Since the communication type is UART, TX from GPS is tied to RXD2 pin on SJ-One and RX from GPS is tied to TXD2 pin utilizing UART2 port. Since the refresh rate was configured to 10hz, the default 9600 baud rate was not sufficient enough. Baud rate on both GPS module and SJ-One board both had to be changed to 115200 baud rate. Although baud could have lower and worked just fine, 115200 posed no issue so it was ideally better to get the message sooner and have a longer time in between the next message to avoid cascading messages in the UART read buffer.
**See Hardware Design for wire diagram.**
Razor IMU - 9 Degrees of Freedom
In Geographical node, IMU module is used to obtain the compass heading with respect to north. The compass heading is used in conjunction with Bearing angle provided by the GPS module to calculate Error angle. Error angle is used to steer car in the direction of the destination coordinate.
The 9DOF Razor IMU provides nine degree of inertial measurement incorporates three sensors - an ITG-3200 (MEMS triple-axis gyro), ADXL345 (triple-axis accelerometer), and HMC5883L (triple-axis magnetometer). The outputs of all sensors are processed by an on-board ATmega328 and output over a serial interface.
Features:
- 9 Degrees of Freedom on a single, flat board:
- ITG-3200 - triple-axis digital-output gyroscope
- ADXL345 - 13-bit resolution, ±16g, triple-axis accelerometer
- HMC5883L - triple-axis, digital magnetometer
- Autorun feature and help menu integrated into the example firmware
- Output pins match up with FTDI Basic Breakout
- 3.5-16VDC input
- ON-OFF control switch and reset switch
Module Calibration
IMU using on board Arduino Controller for processing data coming from the accelerometer, Magnetometer and Gyroscope. We are using Arduino firmware for IMU calibration. Arduino firmware is flashed with the help of the FTDI connector.
- FTDI pin connection with IMU module
| S.R. | FTDI connector | Razor |
|---|---|---|
| 1 | GND | GND |
| 2 | CTS | CTS |
| 3 | 3.3v | 3.3v |
| 4 | TX | RX |
| 5 | RX | TX |
| 6 | DTR | DTR |
- Accelerometer calibration
Accelerometer calibration is done by pointing every axis towards up and down directions and move slowly to get the min and max values respectively and the update the min/max into the firmware file Razor_AHRS.ino.
accel x,y,z (min/max) = X_MIN/X_MAX Y_MIN/Y_MAX Z_MIN/Z_MAX
- Gyroscope Calibration
Gyroscope calibration is done by keeping gyroscope still for 10 seconds and it gives the average gyroscope values in terms of yaw, pitch and roll.
gyro x,y,z (current/average) = -29.00/-27.98 102.00/100.51 -5.00/-5.85
- Magnetometer Calibration
Magnetometer calibration is done using processing software which gives the metrics for offset values, given below. It is also extended calibration which is done by the software. There are two type of calibration for magnetometer, one being the hard calibration and soft calibration being the other.
1. standard calibration: Calibrating the compass with the earth's magnetic field.
magn x,y,z (min/max) = -564.00/656.00 -585.00/635.00 -550.00/564.00
2. Extended calibration: Calibration the compass with the surrounding magnetic fields.
The standard magnetometer calibration only compensates for hard iron errors, whereas the extended calibration compensates for hard and soft iron errors. Still, in both cases the source of distortion has to be fixed in the sensor coordinate system, i.e. moving and rotating with the sensor. Processing software is used to collect magnetic field samples, which is used to develop the magnetometer calibration values by itself. Magnetometer calibration equation generated by the processing.pde on the basis of the samples collected is given below.
 #define CALIBRATION__MAGN_USE_EXTENDED true
 const float magn_ellipsoid_center[3] = {260.000, -125.844, -113.709};
 const float magn_ellipsoid_transform[3][3] = {{0.604193, 0.0917934, -0.0122780}, {0.0917934, 0.884838, 0.0590891}, {-0.0122780, 0.0590891, 0.965924}};
Software Design
The approach to the software design was to try to write modular code. Utilizing OOP concepts, a few classes were created. At the very top, there is the Geo_Manager. The Geo_Manager's role is to call out to GPS_Module and Compass_Module objects to gather raw data and provide it back to the Manager. Next, it sends these raw geo data to the Geo_Calculation_Engine to perform all necessary calculations then sends it back to the Geo_Manager. Finally, the Geo_Manager will send these calculated data onto the Canbus.
Control Flow
Software control flow is very simple. The flow diagram below shows exactly how the code works. Best explanation without creating confusion is to follow the flow diagram:
Implementations
On-Board Debugging Tool Interface
To be able to provide accurate heading error to Master Node, it is very important before subtracting compass angle from bearing angle (see Design & Implementation section) that they both need to be normalize. Since bearing angle uses projection point to North, its angle calculation is in respect to North. The compass on the other hand was giving magnetic heading which is about 12 degrees off from True North. Often, the compass will also drift some X amount so a "Compass Offset" of 12 degree + X drift amount would have to be added to compass heading angle to normalize it to North. This meant whenever the compass drifted, we would have to either recalibrate the compass module or compensate the offset or most of the time do both which were all very time consuming.
To help drastically reduce time wasted recalibrating the compass offset, we utilized the I/O on SJ-One board to quickly adjust compass offset on the fly as well as display important information for us to monitor as the car was being tested.
Utilizing all four push buttons, all LEDs and the 7-segment display on Geo Node board, we implemented three different modes for users to interface with Geo Node. The implementation is shown below:
Operation and Controls:
 @ Any Mode
   Input:  Button #4 - Cycles to the next mode.
 @ Mode 1
   Output: 7-Segment Display - Shows distance of current location to checkpoint in meters
 @ Mode 2
   Output: 7-Segment Display - Shows current heading angle error in degrees
   Input:  Button #1 - Decreases Compass Offset therefore affecting current Heading Angle Error
   Input:  Button #2 - Increases Compass offset therefore affecting current Heading Angle Error
   Input:  Button #3 - Zeros out the Heading Angle Error by applying needed Compass Offset Value
 @ Mode 3
   Output: 7-Segment Display - Shows current Compass Offset Value (This mode is better use to take note of the current Compass Offset Value)
   Input:  Button #1 - Decreases Compass Offset therefore affecting current heading angle error
   Input:  Button #2 - Increases Compass offset therefore affecting current heading angle error
Testing & Technical Challenges
GPS Module
Capturing NEMA Messages from GPS Module
One frustrating problem was trying to read GPS NEMA sentences from the GPS module. Since on default the module provides several types of NEMA messages, it was very difficult to try to capture the one you wanted. Increase the GPS module to 10Hz refresh rate and it becomes a mess. Attempting to filter and only accept the NEMA message type you need was very inconsistent. At times, due to the high refresh rate, many GPS refresh cycles would have gone by before being able to filter the correct NEMA message. Couple this with the fact that often the correctly captured NEMA message with either incomplete or mixed with another message regardless of trying to detect the new-line character. Playing with buffer sizes only helped so much.
The solution to this was to disable all unwanted NEMA messages and only have GPS module send out the 1 or 2 type of messages that are required. This meant filtering for current NEMA messages may not be necessary (we still filter just in case) and it also reduces the traffic allowing UART read buffer to capture from start to finish the full NEMA messages.
IMU Module
Calibrating IMU module to capture Magnetic North Heading
1. The IMU Magetic north heading is drifting. After calibrating the IMU with extended calibration, the compass started to give different north direction after every power cycle and the heading data was drifting back to same angle after moving the compass.
Solution: Compass drifting issue is resolved by removing the error correction code and by reverting back to using the standard calibration.
2. When IMU mounted on the car, IMU heading started to produce different heading at different locations specially near the Medical building.
Solution: Reason for IMU compass abnormal behavior was Magnetic interference. we resolved the issue by increasing the height of the compass module from the main board to limit the magnetic interference. we also added some shielding the IMU module to limit stray magnetic interference.
Communication Bridge Controller
Design & Implementation
The Communication Bridge controller is one of the most Important ECUs in Titan's Car as it is the only interface through which user can communicate with Car. This module have Bluetooth BLE chip through which the ECU connects with Android Application. The user can set destination from the Android Application and read important data from car such as sensor values, car speed, current GPS coordinates. The ECU communicate with Master controller to provide route data and read data of other ECUs from CAN bus. This section gives details of Hardware and Software design.
Hardware Design
For the hardware design we have used SJOne Board, Bluetooth BLE Chip, CAN Transceiver and Android Smartphone. Specifications of the hardware components are as given below.
Hardware Components
1. SJOne Board
|
Specifications: |
2. Bluetooth BLE Dual Bee
|
Specifications: |
3. CAN Transceiver
|
Specifications: |
Pin Layout
|
Pin Layout specifies that how the pins of SJOne board are connected to other hardware components to design the system. |
|
Block Diagram
In this section hardware block diagram of the system is shown. All the hardware components are connected to each other. Android phone communicate with BLE chip via Bluetooth link, Bluetooth chip communicate with SJOne board via UART. SJOne board is connected to CAN Bus through CAN Transceiver MCP2561.
- Here is the hardware block diagram of Communication Bridge Controller.
Hardware Interface
This section provides the information on how hardware works. The data in this module have two flows. (1) From Android Application to CAN Bus, (2) From CAN Bus to Android Application. In First, The data originated at Android app is delivered to SJOne board through Bluetooth BLE Chip then Data are transmitted over CAN Bus from SJOne board through MCP 2561 chip. In Second flow the data flow is in exactly opposite direction as shown in GIF below.
Software Design
In this section we have given initial abstract design of our software in the form of three UML Diagrams: Usecase Diagram, Statechart Diagram, Activity Diagram.
Usecase Diagram
Since the android application and the bridge controller is the only module on the whole car which comes in direct contact with the user, we have a use case diagram. The use case diagram is pretty simple as the role of the user in this project is limited to connecting to the car and selecting the final destination. The use case of connecting to the car includes the whole process of bluetooth connection process. The use case for giving the final destination includes the whole google maps api call and getting the checkpoints.
Following is the abstract view of our system and how user can interact with our system. The usecase diagram here describes that user can connect with the car and set the destination for the car using the android app designed for this project.
Statechart Diagram
The state diagram is a behavior diagram that shows the behavior of our system at particular instance of time.
For android application, since we used the Bluetooth BLE module, our whole bluetooth connection algorithm was a state machine. The BLE module uses Gatt server and client methodology for connection. So when we open the app, it first checks for bluetooth, if it is powered on. Once it is powered on, it goes in connection state where it checks if the GATT server is registered or not. Once it connects with module it goes into data read and write state. Since, read and write doesn't happen in parallel, it toggles between these two states. Once the destination is given it goes into the state of calculating the route and writing on to the bluetooth module.While for the SJ One board, the states are pretty simple. As soon as the board boots, it goes into the waiting stage where it waits for the data to arrive from app or CAN bus. If the data arrives from the app, it encodes and sends the necessary data on the can. If the data arrives from CAN, it decodes the data and utilizes the same.
The following shows the state chart diagram of Android application and SJ One board
Activity Diagram
The diagram shows the different activities which are being performed on both the the application and the SJ One board. The activities being performed comes directly with user interaction while the activities on the board are in synchronous with application and other nodes. There is no direct user interaction for the activities on the SJ One board. The activity diagrams for the android application and SJ One board are as follows:
Implementation
This section shows the implementation details of Mobile application as well as SJOne Board code. It also depicts some algorithm and tricks that we have performed to handle some issues.
Bluetooth Connection
As we have used Bluetooth BLE module and it does not function same as Standard Bluetooth we have followed some different way of implementation of Bluetooth data transfer. First of all as we have made our application in a way such that it contains only one activity and because of that we had to implement manual Bluetooth connection button. When Activity starts it checks if Bluetooth is on or not. If Bluetooth is off it ask user to give permission to turn on the Bluetooth. In this way we have increased connection reliability.
Getting Route
Google Maps were integrated as a fragment activity inside the android application. The source destination of the car was taken from the GPS module and a marker was placed pinpointing the current location of the car. We registered a developer’s account on Google to get an authentication key for using the Google maps API. We use the current location of the car as the source destination and then give the final destination in the Google Maps. The API calculates the path with intermediate checkpoints on the application side. We created a JSON parser on the application to decode the waypoints, as Google Maps returns the data in form of a JSON object. On top of the checkpoints given by the maps, we add our own intermediate checkpoints at equal distance, which helps the car to be stable on the path.
Message Format
As BLE module can send only 20 bytes of data in one package and 10Hz task is able to send only 3 data packet on BLE along with performing other functions we used below mentioned two data packets.
1. L<2_byte_left_sensor_value>R<2_byte_right_sensor_value>C<2_byte_center_sensor_value>B<2_byte_back_sensor_value>SPD<5_byte_speed_value>
2. @<8_byte_latitude_value>$<10_byte_longitude_value>
Geo Coordinates Interpolation
Google gives coordinates which are so far apart that some times distance between two coordinates is ~80 meters. GPS module is not able to follow this much far apart coordinates so we have done Interpolation to get more coordinates at a distance <=15 meters so that car can follow the path correctly. Following is a psuedo code for the same.
while distance_between_current_and_next_coordinate > 15
next_coordinate_latitute=[current_coordinate_latitude+next_coordinate_latitute]/2
next_coordinate_longitude=[current_coordinate_longitude+next_coordinate_longitude]/2
Testing & Technical Challenges
The following table shows the different test cases we implemented, the expected outputs and the image/gif of the actual outputs.
| Test Case # | Definition | Expected Output | Test Outcome |
|---|---|---|---|
| 1 | Bluetooth is off when the application has opened. | The application will ask for permission to turn on the bluetooth | |
| 2 | If the Destination is not set, and if the user tries to give the start command. | The application will ask the user to select the destination first | |
| 3 | Input the destination to get the routes. | The application will calculate the route from source to destination along with intermediate checkpoints. | |
| 4 | Send Coordinates from the application to the board. | The board should receive all the coordinates. This is indicated by the glow of 4 LEDs. The first LED should glow when it receives the first coordinate.
|
Technical Challanges
- Establishing Reliable Bluetooth Connection
- Send Important data to Android Application
- Getting Coordinates correctly from the App
- Sending Coordinates to Master Controller
Master Controller
Design & Implementation
The master controller acts as the brain of the car and coordinates between the other 4 nodes to achieve smooth navigation of the car.It accepts data from the sensor node, the app node and the geo node and makes driving decisions based on that data. It is the central controller of the entire system. It works on the heartbeat mechanism.
Hardware Design
The master controller has the basic design of interfacing with the can bus. It has to communicate with the other nodes using the CAN bus transcievers. The figure below show the hardware design of the master.
- Below is the pin connection table of the master controller to the CAN bus
| S.R. | CAN Transiever Pins | SJOne Board Pins |
|---|---|---|
| 1 | Vin | 3.3v |
| 2 | GND | GND |
| 3 | TX | P0.1 (RXD3) |
| 4 | RX | P0.0 (TXD3) |
Software Design
We will discuss the software design of the master in this section. The architecture of the master node is vast and hence we decided to make extensive use of classes and inheritance in C++.
Software Architecture
Structure The software is architectured in a layered fashion with two main layers: application layer and hardware control layer. There are two classes in the application layer (Coordinator and TrajectoryEngine). They are responsible for high level, application specific tasks. The Coordinator has a simple ‘use’ association with the TrajectoryEngine, and it associates via composition to a less abstract layer (Node Control) responsible for hardware specific activities.
The UML class association diagram for the Master Node software is shown below:
As seen in the diagram, Node Control layer is composed of 3 classes, while the application layer is composed of 2 classes.
Components
Application Layer CRC
Class: Coordinator
Responsibility: The coordinator orchestrates periodic status requests and order generation to drive the car. It gathers status from all nodes, process the information and then uses it as an input to the trajectory engine as to generate the next order.
Collaboration: The coordinator uses facilities in SensorControl to update sensor states according to the sensor readings from the CAN bus. It uses GeoControl to store and sequence GPS coordinates, as well as to update heading error bases on compass readings coming in from the CAN bus. It uses the TrajectoryEngine to generate the next motor speed and steering order bases on outputs from Sensor and Geo Control.
Class: TrajectoryEngine
Responsibility: To decide where to turn next and how fast to drive based on current state of sensors and heading error.
Collaboration: It returns the current motor order (steering and speed) to the Coordinator
Node Control Layer CRC
Class: SensorControl
Responsibility: To transform raw sensor numerical readings into meaningful sensor states.
Collaboration:It gets raw readings from Coordinator and returns it the sensor states.
Class: GeoControl
Responsibility:To store and sequence through the vector of trajectory coordinates as well as to turn raw numeric heading readings into meaningful steering states.
Collaboration:It gets raw readings from Coordinator and returns it the steering states. It also gets the coordinate inputs and sequence requests from Coordinator and returns it the current appropriate coordinate vector element.
Behavior
The Heartbeat
The system works with a periodic 10Hz heartbeat. At every period, the Master node sends out an order in the CAN bus, and it receives a status from each node. The nodes only put messages on the bus upon reception of the heartbeat from the Master node. This helped the master get information from the nodes whenever it is ready and avoided the cluttering of the CAN bus.
Coordinator States
When the program starts, the Coordinator waits for the Mobile App node to signal that it a trajectory is ready. When this happens, it then goes into driving mode.In the driving mode you have to provide a start and an end point to the car using the APP,this data will then be sent to the master using the CAN bus and the master will use this information to build the trajectory. It also has a mode to drive indoors, independently from the app. At any given time, the coordinator is in any of the following states:
Idle: it waits for ‘Ready’ signal from Mobile App node which triggers a transition to Build Trajectory.
Build Trajectory: It gets the trajectory from the Mobile App node, point by point, and it stores the coordinates in a vector in the Geo node. Once the last coordinate signal is received from Mobile App, it then transitions to Driving.
Driving: It generates motor steer and speed order based on the TrajectoryEngine outputs.
Trajectory Engine States
The trajectory engine is a state machine which generates steering and speed updates bases on current sensor and heading states.
It can be summarized by the following state diagram:
Turning decisions are always made in the Forward state. When a turn decision is made, the next state will execute the turn until the condition which initiated the turn in the first place is absent. At that point the state machine returns to forward.
Implementation
The master controller has to coordinate with the other nodes in a particular sequence to make the car work. Below we have put an animated figure of how the car works and the sequence in which the master coordinated with other nodes.
The overall flow chart for the master controller is shown below. We had a lot of state machines in place and hence we were able to navigate through the path correctly.
The flowchart below shows the master handling the geo node.
Testing & Technical Challenges
Testing
The testing of the car should begin early in the project phase. Testing is a really important part of this project and we have to test it thoroughly. Many of the issues come up only after testing it multiple times.
- Test the car thoroughly in different areas of the campus, the reason being that some areas of the campus do not recieve good GPS data and the car will try to go offcourse.
- Test the car in different time windows and everyday. When the weather was cloudy we did not get GPS signal as accurate as what we got on a day when the sky was clear.
- Test the car in the corridors and outdoors. You will see that the car requires different sensor range settings indoors and different outdoors.
- Test the car in the day and during the night time. The weather conditions make a lot of difference.
- The car picked up a lot of stray magnetic fields in some areas and hence either mount the compass high on the car or isolate the compass.
Technical Issues
The master module has a lot of challenges and various solutions to each issue. We have described a few below.
- Always modularize your code and have state machines. This helps a lot.
- There was a situation when we were trying to get the data from the app and we missed a few coordinates,for this we made use of vectors instead of using arrays.
- While navigation we were missing a few checkpoints , it would directly go to the 3rd checkpoint and miss second one, We realized this was because it would send the second one but think that it has already reached and send next one too. We had to handle it using counter to make sure it always sends the checkpoints correctly.
- Always have provision such that you can test the car even when the app is not around or not ready. Have a switch defined to start and stop the car.
Issues
Issue #1
Geo Issues
Problem 1: Retrieve bad or incomplete NEMA messages from GPS module.
Solution: Turn off all unwanted NEMA messages from GPS module using manufacture software.
Problem 2: Compass heading error would randomly drift at different location on campus.
Solution: Mount the Compass module higher, away from magnetic interference generate from all electronic components.
Issue #2
Sensor Issues
Problem 1: Front three sensors were interfering with each other when triggered simultaneously. Triggering sequentially resulted in slow response from sensors.
Solution: Replaced middle sensor with a different model which had different burst frequency. This enabled the middle sensor to be triggered at a faster rate. Left and right sensors were triggered alternatively.
Issue #3
Android Application Issues
Problem 1: We implemented the auto connect feature to connect to the Bluetooth BLE module. Due to the GATT server client methodology for connection in BLE technology, connectivity was not reliable.
Solution: We removed the auto connect feature. Instead of the auto connect, we introduced a button, which first searched the connection and then connected to the bluetooth module. So because of the button, it got time to discover the available device. The connection reliability was achieved due to this
Problem 2: Due to a large number of fragments on the application, many of the tasks were skipped on the application side due to a large workload on a single thread.
Solution: We transfered the whole application from single threaded architecture to a multithreaded architecture. The multithreaded architecture stabilized the application and all the task were performed much quicker as compared to the initial implementation.
Conclusion
As a final note, we want to mention that we are proud to have taken this course that led us through new challenges, provided us with tons of knowledge and confidence in ourselves. Even though the technology aspect of the project was diverse, it gave each sub group a chance to learn a little bit of everything. Learning how to communicate with sub groups within a team was also a major take away from this project. Pushing ourselves to new goals and motivating each other to perform better in our group was also a key accomplishment for our team.
One of the common challenges that we all faced in our team was to work with people with different experience and skill levels. While working on the project it was great lesson for member with experience to learn to have patience with members who were slow and less experience. Furthermore, for those with less experience it was good lesson to keep up with every task they were assigned and do it efficiently.
Where technical challenges are concerned, we believe we learned a lot in the area of testing. Persistent testing of our design helped us find hidden problem such as car always going out of track because of inaccurate Google assigned coordinate, calibration of the magnetic compass getting damaged, and the sensor reacting differently to different surroundings. Only after continuously testing we were able to get rid of these problems, for example by setting an offset for GPS values, placing the compass far away from the micro-controller boards so it does not get affected by their magnetic field. Also, by employing multiple software filters to filter out the sensor values and react better to different surrounding.
Project Video
The Titans - Video
The Titans - Self driving RC car video
Project Source Code
References
Acknowledgement
We, Team Titans, would like to thank Prof. Preetpal Kang for Industrial Applications using CAN bus course at SJSU and the continued guidance he provided through out the semester. The course content and his practical teaching helped with the implementation and testing of our project self-navigating car. We also appreciate our Student Assistants(ISAs) for their guidance during the project. Their feedback helped us get through tough obstacles. This project helped us gain the knowledge on various aspects of practical embedded system and also helped us hone our skills. This course and the project will be an asset to our career.
References Used
[1] CMPE 243 Lecture notes from Preetpal Kang, Computer Engineering, San Jose State University. Aug-Dec 2016.
[2] Fall_2014 and Fall_2015 Project Reports
[3] CAN Transceiver
[4] Razor IMU
[5] Google maps API
[6] Activity development
[7] MaxSonar Ultrasonic Sensor
[8] SRF05 Ultrasonic Sensor
[9] LCD datasheet
[10] LCD user manual
[11] Fall'15 and Fall'14 project reports
