Difference between revisions of "F18: Wireless sensor network"
Proj user22 (talk | contribs) (→Pseudo-code) |
Proj user22 (talk | contribs) (→Storage function) |
||
| Line 614: | Line 614: | ||
A sample of the logged data is below: | A sample of the logged data is below: | ||
| − | [[File:DataLogging_sample.PNG|500px|thumb|left|Logged data]] | + | [[File:DataLogging_sample.PNG|500px|thumb|left|Logged data]]<br> |
====Wireless Rx Implementation==== | ====Wireless Rx Implementation==== | ||
Revision as of 01:15, 20 December 2018
Contents
- 1 Wireless Sensor Network
- 2 Abstract
- 3 Objectives & Introduction
- 4 Team Members & Responsibilities
- 5 Schedule
- 6 Parts List & Cost
- 7 Design & Implementation
- 8 Hardware Interface
- 9 Software Design
- 10 Testing & Technical Challenges
- 11 Conclusion
- 12 References
Wireless Sensor Network
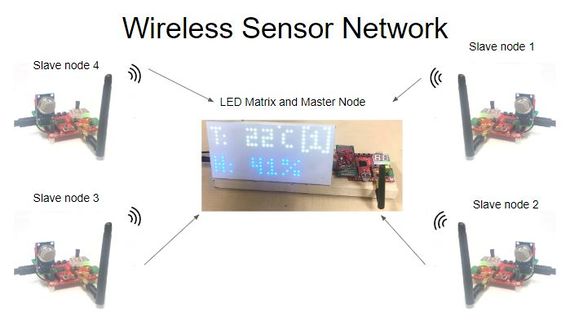
Wireless Sensor Networks project displays data received from various nodes on a 16*32 LED Matrix which is connected with the Master node (SJOne Board).
Each node measures various environmental parameters from it's surrounding and send those data to master in form of packets.
Abstract
A wireless sensor network (WSN) consists of collection of sensor nodes. Each individual node consists of MCU with on-board sensors and Nordic wireless mesh for communication, which are distributed to monitor physical or environmental conditions, such as temperature, ambient light, humidity etc. The SJ-One board contains an onboard light intensity sensor, and a custom PCB for the project has a combined Temperature, Pressure, and Humidity sensor and an air quality sensor. These sensor data are transmitted to a network coordinator which is the controls the wireless mesh network. The advantage of a mesh configuration is that the data flow is uninterrupted in the network even if one of the nodes fails. The coordinator board colates the data from all nodes, and displays it on a 16x32 LED matrix.
Objectives & Introduction
This project was a culmination of a semester of learning about FreeRTOS and embedded software. Our objectives were to apply what we had learned, while also using our critical thinking and problem solving to figure out how to implement parts of our project that we didn't yet know how to do, such as interfacing with an LED Matrix display and wireless communication. In this project we have created wireless network which includes one master node(SJ-One board), 4 slave nodes(SJ-One board) and LED matrix on which we will display data. Purpose of these network is to measure pressure, temperature, humidity and air quality of surrounding atmosphere. We are using MQ135 for air quality sensor and BME280 sensor for pressure, temperature, humidity. These network will work as follow.
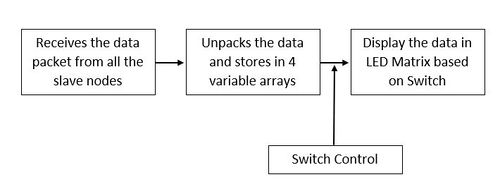
- 4 slave nodes have sensors on them which will sense atmospheric parameters and do some process on them to convert them into human readable data.
- Slave will send these data to master node.
- master node will transfer these data to LED matrix.
- LED matrix will show us data one of the slave node which we have selected from master node.(Select node using on board switches on master node)
Team Members & Responsibilities
- Halak Vyas
- Temperature, Pressure and Humidity Sensor Driver (BME280), RTC Config (primary), Wireless driver (secondary), .
- Jay Parsana
- Display driver (primary), Sensor drivers
- Prashant Gandhi
- PCB Assembly, PCB Design (review), Sensor drivers
- Tristan French
- Team lead, PCB Design (primary), PCB Assembly (secondary), Display driver (secondary)
- Vatsal Makani
- Wireless driver (Primary), PCB design (secondary), Wiki lead
Schedule
| Week# | Date | Task | Actual |
|---|---|---|---|
| 1 | 10/9 | Tristan
Everyone
|
Tristan
Everyone
|
| 2 | 10/16 | Everyone
|
Everyone
Unforeseen issues
|
| 3 | 10/23 | Vatsal
|
Vatsal
|
| 4 | 10/30 | Halak
Tristan
|
Halak
Tristan
|
| 5 | 11/6 | Halak
Jay
Prashant
Tristan
Vatsal
|
Halak
Jay
Prashant
Tristan
Vatsal
|
| 6 | 11/13 | Halak
Jay
Prashant
Tristan
Vatsal
|
Halak
Jay
Prashant
Tristan
Vatsal
|
| 7 | 11/20 | Halak
Jay
Prashant
Tristan
Vatsal
|
Halak
Jay
Prashant
Tristan
Vatsal
|
| 8 | 11/27 | Halak
Jay
Prashant
Tristan
Vatsal
|
Halak
Jay
Prashant
Tristan
Vatsal
|
| 9 | 12/4 | Halak
Jay
Prashant
Tristan
Vatsal
Everyone
|
Halak
Jay
Prashant
Tristan
Vatsal
Everyone
|
| 10 | 12/11 | Everyone
|
Everyone
|
| 11 | 12/19 | Everyone
|
Everyone
|
Parts List & Cost
Top level BoM
| Item# | Part | Source | Quantity | Unit
Cost($) |
Total
Cost($) |
|---|---|---|---|---|---|
| 1 | SJ One Board | Preet | 5 | 80.00 | 400.00 |
| 2 | Adafruit RGB LED Matrix | LED Matrix | 1 | 24.95 | 24.95 |
| 3 | LED matrix Connector board | LED Matrix | 1 | 1.00 | 1.00 |
| 4 | Led Matrix Power Adapter | N/A (Stock) | 1 | N/A | 0.00 |
| 5 | Air Quality Sensor | Willwin | 4 | 4.50 | 18.00 |
| 6 | Custom Sensor PCB Assembly | In House | 4 | 14.72 | 58.87 |
| 7 | CR1225 RTC Battries | Amazon | 10 | 0.7 | 6.99 |
Total (minus SJ One cost): $109.82
Custom PCB BoM
| Item# | Part | Source | Quantity | Unit
Cost($) |
Total
Cost($) |
|---|---|---|---|---|---|
| 1 | Custom Sensor PCB | JLCPCB | 4 | 0.20 | 0.80 |
| 2 | SMD P, T, H sensor | Digikey | 1 | 6.628 | 6.628 |
| 3 | USB mini-B SMD receptacle | Digikey | 1 | 0.87 | 0.87 |
| 4 | 2-position screw terminal, .1in pitch | Digikey | 1 | 0.595 | 0.595 |
| 5 | 2-pin male header, .1in pitch | Digikey | 2 | 0.099 | 0.198 |
| 6 | 4-pin female header, .1in pitch | Digikey | 1 | 0.45 | 0.45 |
| 7 | 17-pin female header w/ long pins, .1in pitch | Digikey | 2 | 1.719 | 3.438 |
| 8 | Red SMD LED, 0603 | Digikey | 2 | N/A | 0.00 |
| 9 | 100 Ohm SMD resistor, 0603 | Digikey | 1 | 0.30 | 0.30 |
| 10 | 300 Ohm SMD resistor, 0603 | Digikey | 1 | 0.066 | 0.066 |
| 11 | 2.2 kOhm SMD resistor, 0603 | Digikey | 2 | 0.024 | 0.048 |
| 12 | 3.3 kOhm SMD resistor, 0603 | Digikey | 2 | 0.024 | 0.048 |
| 13 | 4.7 kOhm SMD resistor, 0603 | Digikey | 4 | 0.30 | 1.20 |
| 14 | 0.1uF ceramic capacitor, 0603 | Digikey | 2 | 0.038 | 0.076 |
| 15 | SMD Air Quality sensor | Digikey | 1 (optional) | 12.88 | 0.00 |
| 16 | 2-pin jumper, .1in pitch | Digikey | 1 (optional) | 0.45 | 0.00 |
Total: $14.72
Design & Implementation
The design section can go over your hardware and software design. Organize this section using sub-sections that go over your design and implementation.
Hardware Design
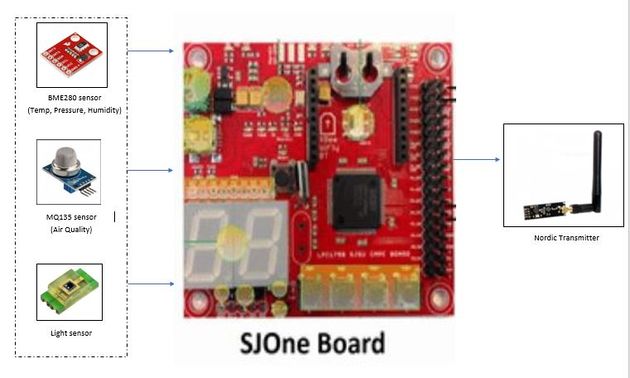
The project is based around the SJ one board, which uses an LPC1758 Arm Core M3 microcontroller. The system design consists of two main devices: a wireless master with a display and a wireless sensor node (of which there are several).
Wireless Master
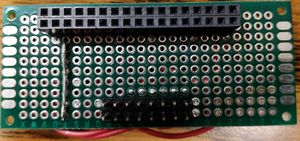
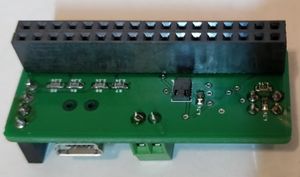
The master board's role is to drive the LED matrix, and receive and log the sensor data. The majority of the functionality of the master can be handled with the default hardware on the SJ One board. The only addition necessary was an antenna for the wireless chip, and a custom connector board.
The custom connector board mounts to the 17x2 header on the SJ One board, and the pins were routed to the appropriate pins of a 2x8 pin header, which the matrix plugged into.
Wireless Slave Node
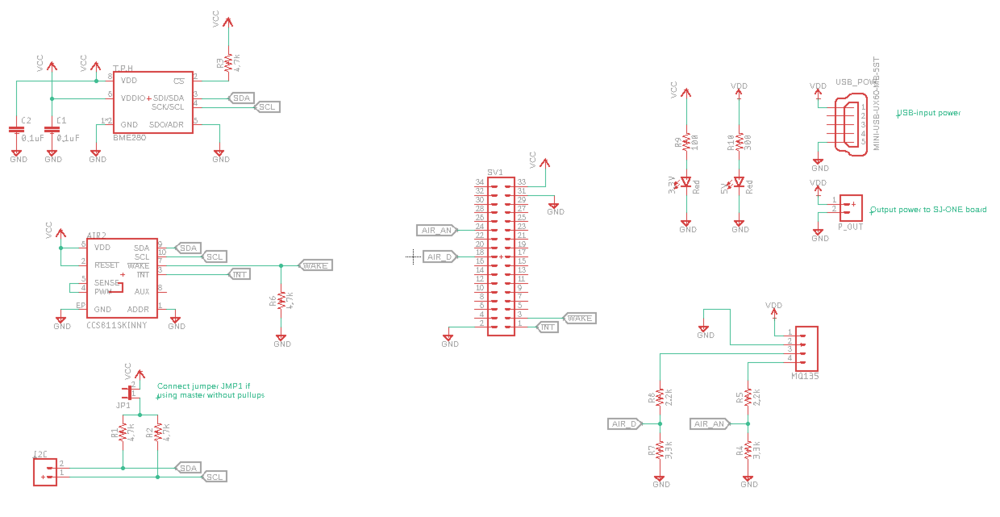
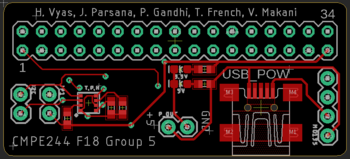
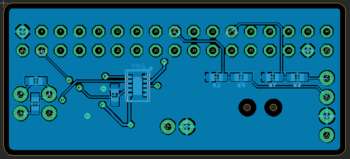
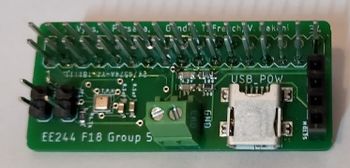
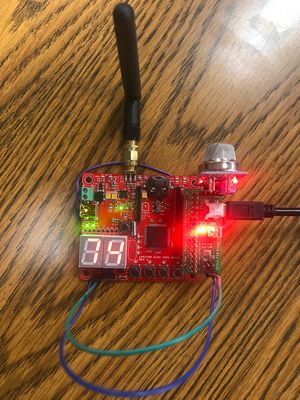
Each slave node has to interface with each of its sensors and send the data wirelessly. The sensors were interfaced using a custom PCB shown below.
The PCB accomplishes the following:
- Accept USB mini power
- Provide 5V output to power SJ One
- Robust and compact mounting to SJ One board
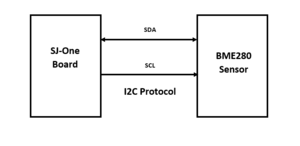
- Provide I2C connection for BME280
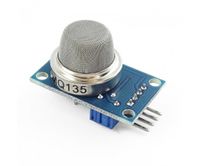
- Mounting header for MQ-135
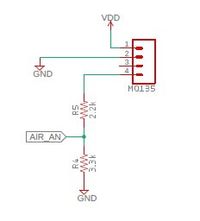
- Voltage divider to convert 5V analog output from MQ-135 to 3.3V
- Leave unused SJ One pins available for other uses (accessible through extra long header pins)
The PCB design was completed in Eagle
Hardware Interface
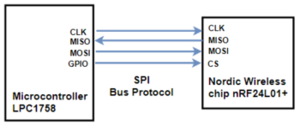
The system utilizes several different interfaces to achieve its purpose. Specifically, it uses a 2.4GHz Nordic Wireless protocol, I2C to read sensors, an ADC to read sensors, and SPI to log data on an SD card.
LED Matrix
The LED matrix is controlled through a 12-pin header consisting of the following pins:
- An output enable (oe) which turns the LEDs on when pulled low
- Latch pin (lat) which prevents data being shifted into the shift registers when set high
- Clock pin (clk) which triggers a shift on the shift registers
- Three Address pins (rA, rB, and rC) to select the row
- Three RGB pins for the top half (R1, G1, and B1)
- Three RGB pins for the bottom half (R2, G2, and B2)
Nordic Wireless
The Nordic nRF24L01+ wireless sensor is a highly integrated, ultra low power (ULP) 2Mbps RF transceiver IC for the 2.4GHz ISM (Industrial, Scientific and Medical) band. The nRF24L01+ is designed for operation in the frequency band of 2.400 - 2.483GHz. The high air data rate combined with two power saving modes make the nRF24L01+ very suitable for ultra-low power designs. This chip is interfaced with LPC1758 microcontroller of SJOne Board using SPI pins (MOSI, MISO, CLK, CS). It is the on-board chip in SJOne Board, so no breakout board connections are required for this project. We had to attach a RP-SMA Adapter as well as antenna to communicate between the multiple nodes and the master board.
Sensors
Light Sensor
Light Sensor is an on-board sensor in SJOne Board which interfaces with LPC1758 microcontroller at Port 0, pin 25 analog signal. This sensor shall give the raw value to the controller which will be processed by 12-bit microcontroller ADC. The output of the sensor is shown in a form of 'bulb' indication in LED Matrix
Temperature, Pressure & Humidity (BME280)
BME280 supports both SPI and I2C bus communication. In our wireless mesh project we have used I2C bus over SPI as I2C can read and write registers very easily in compare to SPI and Nordic Wireless is already using SPI bus.Here we are using BME280 sensor of Bosch which has a facility to measure Temperature, Pressure and Humidity. It uses 3.6 microAmps of current at 1Hz and requires 3.3V of voltage which SJOne provides it.
Operating Range : Temperature (-40C to +85C), Pressure (300 to 1100hPa), Humidity (0% to 100%) with +- 1% of tolerance.
The sensor facilitates the user with various modes of operation which can be selected as per preferred environmental conditions. There are basically 3 modes for which range of IIR filter is varied. Those modes are - Indoor Navigation, Weather Monitoring and Gaming Mode. We have facility to switch between those modes, but here for our project we are using Indoor mode as our project is designed to test laboratory environment.
Air Quality Sensor
MQ135 is used for air quality measurement in this project. MQ135 is a low cost semiconductor sensor which can detect Carbon-Dioxide(CO2), Benzene, Smoke, Ammonia(NH3), Mono-nitrogen oxide. Sno2 is used as sensitive material in this sensor and it's conductivity is low in clean air. As the concentration of these sensing gases increases, sensor conductivity also increases. This module can give both analog and digital outputs. For this project we are using analog output. Analog output can go upto 5V, but our SJ-One board can support maximum 3.3V as input, so we need voltage divider circuit which can convert 5V output from module to 3.3V. As we are using analog pin output from module we will configure ADC driver of SJ-One board to read that ADC value and calculate ppm for CO2. Note that in this project we will calibrate our value such that we will get CO2 ppm.
Software Design
Master node with LED Matrix
General Layout fro displaying Data on LED Matrix
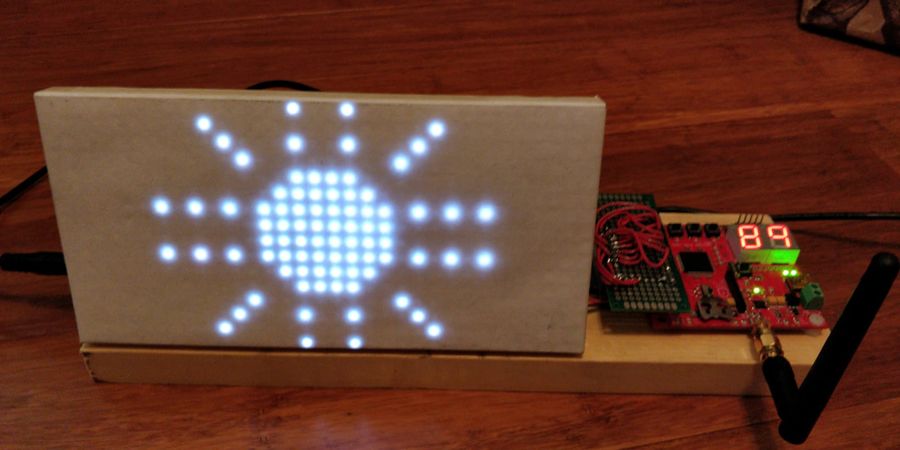
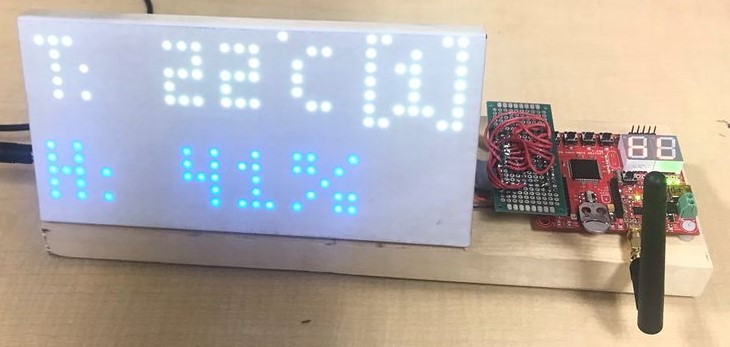
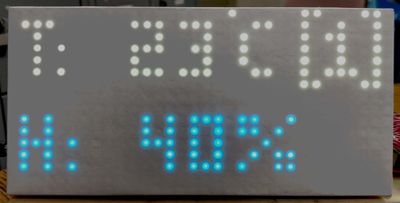
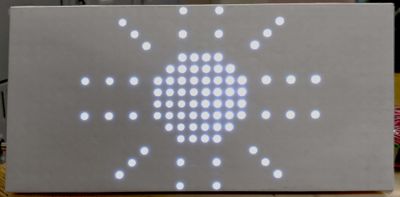
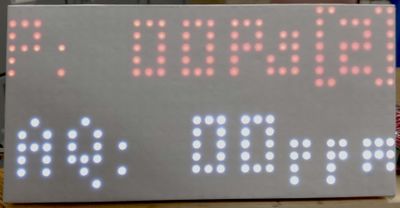
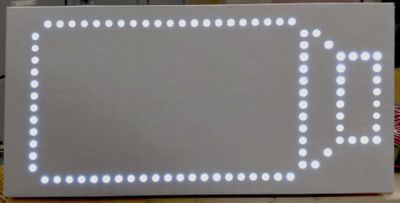
We basically made a bit pattern on the matrix for the 4 screens and each of them displays:
| Screen# | Row (0:7) | Row (8:15) |
|---|---|---|
| 1 | Temperature and Node number | Humidity |
| 2 | Temperature(Sun) | Temperature(Sun) |
| 3 | Pressure and node number | Air Quality |
| 4 | Light bulb with bars | Light bulb with bars |
| | |
It’s the layout of how the display would look for all the screens. We made use of a lookup table for units tens and hundreds positions to update the sensor value on the led matrix. For the LED matrix control signals, as mentioned above in the hardware part, we are making use of SJOne boards 12 GPIO pins.
MatrixTask:
This task that will perform functions like initializing these GPIO pins to output. Here we are scanning the led matrix at a rate of about 500Hz. We have a row_selection function that will go through each and every row one by one. The OE(Output Enable) will be set to high to keep the display off while the data is being buffered to the matrix. We have an ev_switch function inside the matrix task that will buffer the data along with different colors for all the different sensors. Also the ev_switch function when displaying the temperature will switch to temp_color task which will choose different colors for various temperature ranges. The data is being buffered with a duty cycle just like the PWM to control the brightness of the matrix. After pushing the data on to a single row we turn the OElow to turn the display ON and then set the LAT(Latch) high to mark the end of the data for the row.
SwitcherTask:
Its has a medium priority and it will cycle between four screens for about 2 seconds for each screen thereby blocking this task for 2 seconds. We have 2 pointers top and bottom that will fetch the layout from the lookup table and based on the value of the switcher variable it will update layout that it has to display. If the value of the switcher variable is 1, top and bottom will fetch temperature and humidity layout for the top and the bottom portion of LED Matrix respectively.
Matrix_Value_Update_Task
Here we have a matrix_value_update function that will parse the sensor values received from the nodes using value_extractor function and assign it to a values struct object which has 0-9 value for the struct members units, tens and hundreds. These values are then passed to a lookup_switch function which will lookup a matrix of 5x3 that matches the 0-9 digit value and assign it to a pointer. The data indicated by the pointer will overwrite the general layout for each sensor value thereby updating the sensor values on the LED Matrix. The same will follow when we update the node number in screen 1 and screen 2. The switching between the nodes has been implemented in this task. We scan the switches and based on which switch is pressed we display the respective sensor values.
Pseudo-code
- Initialize GPIO pin as output.
- Set OE(Output Enable) to high and LAT(Latch) to low.
- Select row to which the data will be shifted.
- Enter the RBG data for a single pixel.
- Assert the clock pin to high and then set it to low to shift the data in the pixel.
- Deassert the clock pin.
- DO this for 32 pixels and then set the LAT to high to indicate end of row and set OE low to display the data.
- Introduce some delay which will be proportional to the ON time of the led i.e. set the duty cycle.
           for (int j = 0; j < no_of_rows; j++) {
               lat.setLow();
               oe.setHigh();
               row_selection(i);
               for (int j = 0; j < no_of_pixel_on_each_row; j++) {
                   input_data(i, j);
                   clk.setHigh();
                   clk.setLow();
               }
               lat.setHigh();
               oe.setLow();
               delay_us(on_time);
           }
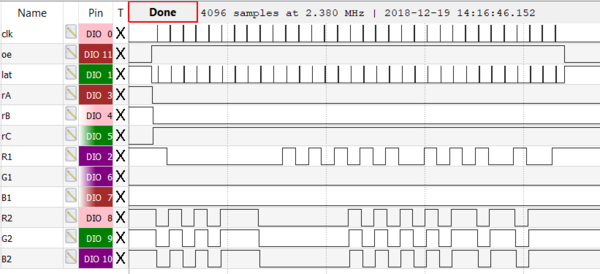
The image below shows a logic analyzer capture of the display of one row of the matrix.
Datalogging Task
The master module, in addition to displaying the data received from all of the nodes, logs the data to an SD card on the SJ One board.
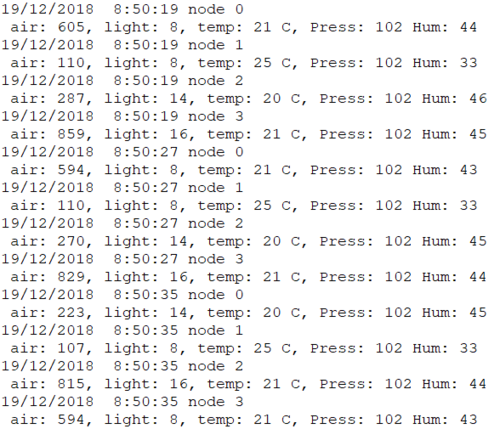
The data is stored in a structure which holds all sensor values for all nodes. The data for each node is combined into a string using sprintf(), along with the timestamp from rtc_gettime(), and that string is appended to a text file named with today's date.
Storage function
   a = rtc_gettime();
   for(int i = 0; i<4; i++)
   {
       //Create filename
       sprintf(fs, "1:SensorData_%i%i%i.txt", a.day, a.month, a.year);
       //Create data string
       sprintf(ds,"%i/%i/%i  %i:%i:%i node %i \n air: %i, light: %i, temp:
               %i C, Press: %i Hum: %i\% \n", a.day, a.month, a.year, a.hour,
               a.min, a.sec, i, s1[i]._air_q,s1[i]._light,
               s1[i]._temp,s1[i]._psi,s1[i]._hum);
       //Append data to log file
       Storage::append(fs,ds,strlen(ds), 0);
   }
This storage function is inside of a logging task, which waits for a binary semaphore to be sent from the matrix task, signaling that it the screen is changing values, and it is okay to store the data. The reason for this is that writing the data to the SD card is slow, and if it was allowed to happen anytime, it would cause a flicker in the screen. Like this, the delay happens when the screen is already changing, therefore the small off time is not noticeable.
A sample of the logged data is below:
Wireless Rx Implementation
Nordic Wireless Rx and Tx implementation is done using Preet's Low Powered Mesh Network stack.Each packet is sent via an existing route, and if route has changed, a new route is automatically discovered using a special retry packet.However for our application, all the slaves nodes directly transmit data to the master node so there won't be any other nodes in the path. The minimum payload is 9 bytes, of which, 8 bytes will be the mesh header overhead which contains the network source and destination information, along with packet type and hop count information.
For example, if the payload size is 32 bytes, then 8 bytes are used by the network header and 24 bytes are free to be used for transmitting the data.The mesh_packet_t is a structure that is used to transmit the data to understand the data of the wireless packet. It has 4 struct variables.
- nwk : Packet network address
- mac : packet physical address
- info:Packet header
- Data:Type of data to be sent which is 24 bytes.
Slave Node (Sensor reading)
This section includes implementation and calculations for all sensors(Temperature,Pressure,Humidity,Air Quality,Light) implemented at the software design in the slave node. These sensors reads the data and sends the data to SJOne board which processes the data and performs the desired calibrations. These calibrations are required to convert the Raw value to a readable value. These sensor readings are then combined together to form a single packet and transmitted wirelessly to master node using nordic nRF24L01+ chip.
Pseudo-code
- Initialize ADC
- Initialize BME280:
- Create wireless transmit task
- Start task scheduler
- Start wireless transmit task
- Initialize wireless parameters
- Initialize Air quality sensor variables
- Start while 1 loop
- Start Calibrating ADC readings according to atmosphere CO2 value
- Calculation:
    MQ_135 = adc0_get_reading(3);
   __resistance=((4095./(float)MQ_135) - 1.);
   temp = __resistance/33;
   air_quality = (PARA*pow(temp,-PARB));
- Get temperature data in form of float from the sensor by reading 0xFA through 0xFC and using it to calculate raw temperature data.
- Raw data is converted into degree C using some mathematical calculation as shown below
   temp = (temp * 5 + 128) >> 8;
   tempf = (float)temp;
   return (tempf/100.0f);
- Get pressure data in form of float from the sensor by reading 0xF7 through 0xF9 and combining it to get raw pressure data.
- This raw pressure data is converted into actual pressure data in form of kPa.
   press = (((1048576 - press_raw) - (var2 >> 12))) * 3125;
   var1 = ((int32_t)dig_P9 * ((int32_t)(((press >> 3) * (press >> 3)) >> 13))) >> 12;
   var2 = (((int32_t)(press >> 2)) * (int32_t)dig_P8) >> 13;
   press = (press + ((var1 + var2 + dig_P7) >> 4));
   return (pressf/1000.0f);
- Get humidity data in form of float from the sensor by reading 0xFD through 0xFF and combining it to get raw humidity data.
- This raw humidity data is converted into real value in percentage format.
   v_x1 = (v_x1 > 419430400 ? 419430400 : v_x1);
   humf = (float)(v_x1 >> 12);
   return (humf/1024.0f);
Wireless Tx Implementation
The calibrated sensor values are stored into a single int array of size 5 to store all 5 sensor readings. The following function "wireless_send()" is responsible to send the packet wherein the address of the destination node, type of mesh protocol used, pointer to the data to send, length of the data to send and number of hops is passed as a parameter. It returns true if packet is sent successfully. For our application, we are passing the below parameters to the wireless send()
- Our Master LED Matrix node address is selected as 5
- The mesh protocol used is mesh no-acknowledgement
- We will send the int sensor array along with the size.
- For our application, since all the slave nodes directly send data to master node, there shall be no intermediate node, hence the max_hops is taken as 0.
Below is the function:
wireless_send(addr, mesh_pkt_nack, &sensor_data, sizeof(sensor_data), max_hops);
Testing & Technical Challenges
Nordic Wireless
Merging the sensor data into a single packet and transmitting the packet at Tx section. Incorrect values received at the Rx section with significant delay. Ensuring the receipt of packets from the correct node without data corruption.
Sensors
Air quality sensor calibration
To get accurate and stable data, we need to keep MQ135 constantly plug in with power supply for 12 to 24 hours and then we can calibrate the sensor reading. Also every time when we remove power supply we need to reset calibration factor.
LED Matrix
Unstable/inconsistent display on LED matrix. Suspect it is due to high frequency and poor connections with jumper cables, planning to make simple header breakout for more robust connection.
- Header breakout did not help, investigating possibility of an issue with the matrix itself.
- Issue resolved. The breakout board did end up fixing the connection issue, but an erroneous line of code which set the latch too early was the main problem.
Synchronizing all the task after integrating the wireless part was a challenge.
- We were able synchronize the tasks pretty well by changing the priorities and eliminating certain delays.
The data logger task gave a blackout while the sensor data was being displayed on the LED Matrix.
- Solved the issue by synchronizing this task and taking the log of the data when the LED Matrix switches to next screen.
RTC
Time just kept resetting on board reset, even after setting the time. We figured out a bug in implementation, where we had to store some value in "day of year" register to satisfy the if condition that goes to default if of register does shows any value.
Conclusion
Conclude your project here. You can recap your testing and problems. You should address the "so what" part here to indicate what you ultimately learnt from this project. How has this project increased your knowledge?
Project Video
Project Source Code
References
Acknowledgement
We would like to thank Prof. Preetpal Kang for teaching us this course because of which we became familiar with driver development, the knowledge of which helped us in developing this project. We would also like to thank him for motivating and supporting us during the whole journey. We would also like to thank our classmates and ISA team who helped us to solve few bugs.
References Used
- LED Matrix: https://learn.adafruit.com/32x16-32x32-rgb-led-matrix?view=all
- BME-280 : https://www.bosch-sensortec.com/bst/products/all_products/bme280
- Low Powered Mesh Network Stack: http://socialledge.com/sjsu/index.php/SJ_One_Board#Wireless
- Nordic nRFL2401+ tutorial: http://paulfjujo.free.fr/_NRF2401_Transceiver/datas/nrf24l01_tutorial_0.pdf
- MQ-135: https://blog.robberg.net/mq-135-arduino/
- MQ-135: https://hackaday.io/project/3475-sniffing-trinket/log/12363-mq135-arduino-library
- MQ-135: https://www.engineeringtoolbox.com/co2-comfort-level-d_1024.html
