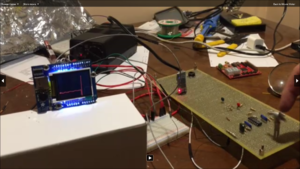
Difference between revisions of "F16: Seismograph"
m (→Schedule) |
m (→Bluetooth Task) |
||
| (12 intermediate revisions by the same user not shown) | |||
| Line 1: | Line 1: | ||
== Project Title == | == Project Title == | ||
<center><big>Seismograph</big></center> | <center><big>Seismograph</big></center> | ||
| + | |||
| + | [[File:CMPE146 F16 T2 seis.png|thumb|center]] | ||
== Abstract == | == Abstract == | ||
| Line 64: | Line 66: | ||
! Part # !! Part Name !! Purchase Location !! Part Specification !! Quantity !! Cost per item | ! Part # !! Part Name !! Purchase Location !! Part Specification !! Quantity !! Cost per item | ||
|- | |- | ||
| − | | 1 || Piezoelectric Vibration Sensor With Mass || [http:// | + | | 1 || Piezoelectric Vibration Sensor With Mass || [http://www.sparkfun.com www.sparkfun.com] |
|| Sen-09197 || 1 || $2.95 | || Sen-09197 || 1 || $2.95 | ||
|- | |- | ||
| Line 133: | Line 135: | ||
=== Hardware Interface === | === Hardware Interface === | ||
| − | When constructing the Seismograph, we needed to incorporate many system interfaces for communcation between the different modules. The following interfaces and | + | When constructing the Seismograph, we needed to incorporate many system interfaces for communcation between the different modules. The following interfaces and technologies were used in constructing the Seismograph and are illustrated below. |
==== Technologies Used ==== | ==== Technologies Used ==== | ||
| Line 148: | Line 150: | ||
* 1.8" TFT LCD Screen | * 1.8" TFT LCD Screen | ||
| − | Apache Cordova is the framework used to construct the android app for the seismograph. The androids app main purpose to connect directly to the HC-06 Bluetooth module using a Bluetooth communication. Once the communication is established, messages can be sent back and forth between the SJONE board using UART communication which is then converted directly into a Bluetooth signal. We implemented this feature into the seismograph to allow for the SJONE board to determine the GPS location of the host user and relay it back when an earthquake happens. | + | Apache Cordova is the framework used to construct the android app for the seismograph. The androids app main purpose to connect directly to the HC-06 Bluetooth module using a Bluetooth communication. Once the communication is established, messages can be sent back and forth between the SJONE board using UART communication which is then converted directly into a Bluetooth signal. We implemented this feature into the seismograph to allow for the SJONE board to determine the GPS location of the host user and relay it back when an earthquake happens. |
| + | [[File:CMPE146 F16 T2 gps.png|thumb|Photo of our GPS and earthquake alert]] | ||
| + | |||
The 4-line SPI interface was used to communicate between the SJONE board and the Adafruit LCD shield. The purpose of this interface is to initialize the board with startup configurations such as register setup and to send the earthquake data to the LCD to be drawn for a graphical representation. When we designed the hardware driver for the SPI communication we used SSP1 and used the following pins for each configuration as illustrated below in the table. | The 4-line SPI interface was used to communicate between the SJONE board and the Adafruit LCD shield. The purpose of this interface is to initialize the board with startup configurations such as register setup and to send the earthquake data to the LCD to be drawn for a graphical representation. When we designed the hardware driver for the SPI communication we used SSP1 and used the following pins for each configuration as illustrated below in the table. | ||
| Line 190: | Line 194: | ||
[[File:CmpE146 F16 T2 lcdflow.png|thumbnail|frame|center|LCD Draw Flow Chart]] | [[File:CmpE146 F16 T2 lcdflow.png|thumbnail|frame|center|LCD Draw Flow Chart]] | ||
| − | The LCD task follows the diagram above and to prevent wrapping and drawing over previous data, we clear the screen when it is at the end and continue drawing. The LCD task uses an internal state machine to draw lines between the points. It takes the initial x0,y0 value and draws a point to the next x1,y1 point. When it continues, it makes the last point the new starting point and continues to draw as it receives values. | + | The LCD task follows the diagram above and to prevent wrapping and drawing over previous data, we clear the screen when it is at the end and continue drawing. The LCD task uses an internal state machine to draw lines between the points. It takes the initial x0,y0 value and draws a point to the next x1,y1 point. When it continues, it makes the last point the new starting point and continues to draw as it receives values. |
| + | |||
| + | The steps to draw pixels to the LCD screen are as follows: | ||
| + | |||
| + | Set the address window: | ||
| + | # Send CASET command | ||
| + | # Send the column address value (this is our x value) | ||
| + | # Send command opcode | ||
| + | # Send the row address value (our y value) | ||
| + | # Send the RAMWR command to write to the LCD memory | ||
| + | |||
| + | Set the pixel: | ||
| + | # Send the RAMWR command | ||
| + | # Send our RGB 565 color value | ||
| + | |||
| + | Each time a command is sent, the our DC pin is cleared since it indicates that the value sent is a command. When we send our data, we pull the pin high by setting it to indicate we are sending data. | ||
| + | |||
| + | As described in the '''Testing and Technical Challenges''' section under ''Working with the ST7735: Setting Our Origin Point'' the column and row addresses are swapped because it was originally intended for portrait display. | ||
[[File:CmpE146 F16 LCDStateDiagram.png|frame|center|LCD State Diagram]] | [[File:CmpE146 F16 LCDStateDiagram.png|frame|center|LCD State Diagram]] | ||
| Line 197: | Line 218: | ||
A mutex was necessary since both writing to the SD card and LCD screen use SSP1 for transferring data.<br /> | A mutex was necessary since both writing to the SD card and LCD screen use SSP1 for transferring data.<br /> | ||
| − | The data stored on the SD card is in the format | + | The data stored on the SD card is in the format (time, ADC value). |
'''Suggestion:''' API for ADC is provided under adc.c and could have been used. | '''Suggestion:''' API for ADC is provided under adc.c and could have been used. | ||
==== Bluetooth Task ==== | ==== Bluetooth Task ==== | ||
| − | The Bluetooth task is used to send an "Earthquake" message to a mobile application via UART. It utilizes a binary semaphore that gets triggered when an earthquake with a value above hex 0xB00 is detected. | + | The Bluetooth task is used to send an "Earthquake" message to a mobile application via UART. It utilizes a binary semaphore that gets triggered when an earthquake with a value above hex 0xB00 is detected. |
[[File:CMPE146 F16 T2 hc06.png|thumb|left|HC-06 Bluetooth Module with PIN Descriptions]]<br /> | [[File:CMPE146 F16 T2 hc06.png|thumb|left|HC-06 Bluetooth Module with PIN Descriptions]]<br /> | ||
| − | + | The mobile application has an event listener that waits to receive a newline (\n) via UART. When it receives it, it prints the message that follows and then brings up an alert window that displays the current GPS location. | |
| − | |||
[[File:CmpE146 F16 MobileAppGPS.png|thumb|frame|right|Mobile Phone Application User Interface]] | [[File:CmpE146 F16 MobileAppGPS.png|thumb|frame|right|Mobile Phone Application User Interface]] | ||
| Line 223: | Line 243: | ||
'''Poor Documentation'''<br /> | '''Poor Documentation'''<br /> | ||
| − | There were problems initializing the LCD screen due to poor documentation. The only provided for the screen itself was given in Chinese so it was very difficult for us to figure out how much voltage the screen required for power on. We ended up having to read through code originally intended to work for the Arduino to understand the initialization process of the LCD screen | + | There were problems initializing the LCD screen due to poor documentation. The only provided documentation for the screen itself was given in Chinese so it was very difficult for us to figure out how much voltage the screen required for power on. In order to figure this out, we connected an Arduino and cross referenced each pin and voltage that was required to power on the screen. We ended up having to read through code originally intended to work for the Arduino to understand the initialization process of the LCD screen. |
'''Setting Our Origin Point'''<br /> | '''Setting Our Origin Point'''<br /> | ||
| Line 239: | Line 259: | ||
== Improvements == | == Improvements == | ||
| − | In the future, we would improve on this project by implementing a joystick that would allow us to scroll through the data history. In addition, the project could be greatly improved upon if we were able to do extra research in getting accurate readings. Essentially, how do we know what voltage corresponds to what magnitude earthquake? In this project, we had to make some estimations and testing based off trial and error to find a value that fit, but we could increase the accuracy of this design through further testing and research. | + | In the future, we would improve on this project by implementing a joystick that would allow us to scroll through the data history. A great deal of research was done to try to get this working. We were able to detect the movements of the joystick but realized too late that we were unable to use the ADC at the same time as the seismograph. This is because, as stated in the manual, when using a software ADC, you can only have values converted in one channel at a time. This meant that we would need to use interrupts to use multiple channels. We also came to the realization too late that these interrupts are actually already implemented in the API provided to us in adc.c. This is a great example of "never reinvent the wheel" and to always read ''thoroughly'' any documentation for any limitations. |
| + | |||
| + | In addition, the project could be greatly improved upon if we were able to do extra research in getting accurate readings. Essentially, how do we know what voltage corresponds to what magnitude earthquake? In this project, we had to make some estimations and testing based off trial and error to find a value that fit, but we could increase the accuracy of this design through further testing and research. | ||
In terms of the mobile application, it currently just receives a message and prints it to screen and a pop up appears with the GPS location. In reality, this would be useless. It would be far more useful to be able to integrate this application with another social media platform like Twitter or Facebook to allow loved ones to know where you are and for people to be able to respond whether they are safe. | In terms of the mobile application, it currently just receives a message and prints it to screen and a pop up appears with the GPS location. In reality, this would be useless. It would be far more useful to be able to integrate this application with another social media platform like Twitter or Facebook to allow loved ones to know where you are and for people to be able to respond whether they are safe. | ||
=== Project Video === | === Project Video === | ||
| − | + | [https://youtu.be/mHpzeNbW12M Seismograph Demo Video] | |
=== Project Source Code === | === Project Source Code === | ||
| − | + | [https://github.com/meenuh/Seismograph Seismograph GitHub Repository] | |
== References == | == References == | ||
| Line 267: | Line 289: | ||
* LPC1758 SJOne Board Rev4 Schematics | * LPC1758 SJOne Board Rev4 Schematics | ||
* [http://www.freertos.org/index.html freeRTOS Documentation] | * [http://www.freertos.org/index.html freeRTOS Documentation] | ||
| − | |||
| − | |||
| − | |||
Latest revision as of 00:45, 24 December 2016
Contents
Project Title
Abstract
In recent years, news of an upcoming large scale earthquake in California has been increasing. Having a seismograph would allow us to directly see any seismic activity. In addition, by adding an LCD screen, we would be able to add plots of the data in a time series manner for any research purposes. Most importantly, the seismograph device would allow to help with search and rescue efforts. When a large scale earthquake is detected, it would allow a signal to be detected via your cellphone in order to ping your GPS location in case of a building collapse.
Objectives & Introduction
Our seismograph would help bring awareness to the realities of earthquakes in California. In addition, it has the possibility to help save lives by aiding in search and rescue efforts when a large earthquake is encountered.
- Create a working seismograph and store data onto a microSD card
- Write software to display data onto an LCD screen
- Add to software to send signals to cellphone via Bluetooth
- Write a small mobile application to receive data via Bluetooth
Team Members & Responsibilities
Both team members will be working on all areas of development with specific focuses as follows:
- Mina Yi
- Focus on software
- Display data on LCD screen
- Mobile application to recognize signal
- Focus on software
- Andrew Ahwal
- Focus on hardware portion to build a working seismograph
Schedule
- Responsibility and leadership of the task is indicated by the Assignee.
- However, it does not mean that they will be expected to complete the tasks alone.
- Subtasks are listed in the comments section and are numbered.
- Subtasks will be delegated as seen fit.
- Any deviation to the schedule due to technical issues will be covered under the Testing & Technical Challenges section.
NOTE: Documentation is not specifically listed in our project schedule. However, each task has a documentation phase before and after each task.
| Task# | Start Date | End Date | Task | Assignee | Status | Date Completed | Comments |
|---|---|---|---|---|---|---|---|
| 1 | 10/30 | 11/12 | Order components | Both | Complete | 11/6 | |
| 2 | 10/31 | 11/7 | Read datasheets & research | Both | Complete | 11/7 | |
| 3 | 11/6 | 12/1 | Interfacing Bluetooth | Mina | Complete | 12/17 | 1. Set up development environment
2. Create the mobile application 3. Interface SJOne board with the application 4. Send notification via bluetooth |
| 4 | 11/6 | 11/17 | Build Seismograph circuit | Andrew | Complete | Circuit 11/13 | Expected circuit completion date: 11/14
Expected testing dates: 11/14 - 11/17 |
| 5 | 11/18 | 11/18 | Progress update | Both | Complete | 11/18 | In class demo of our progress. |
| 6 | 11/18 | 11/20 | Interface seismograph circuit with SJOne board | Andrew | Complete | 11/20 | |
| 7 | 11/21 | 12/7 | Integrate LCD screen with SJOne board & seismograph | Mina | Complete | 12/17 | 1. Fetch data created by the seismograph
2. Display data on the LCD screen |
| 8 | 12/7 | 12/20 | Testing and tweaking finalized product | Both | Complete | 12/20 |
Parts List & Cost
| Part # | Part Name | Purchase Location | Part Specification | Quantity | Cost per item |
|---|---|---|---|---|---|
| 1 | Piezoelectric Vibration Sensor With Mass | www.sparkfun.com | Sen-09197 | 1 | $2.95 |
| 2 | MicroSD | Frys Electronics | 16GB | 1 | $9.99 |
| 3 | Adafruit 1.8" Color TFT Shield w/microSD and Joystick | www.Amazon.com | NA | 1 | $34.99 |
| 4 | HC-06 Bluetooth Module | www.Amazon.com | NA | 1 | $8.99 |
| 5 | 1 nF Capacitor | HSC Electronics | NA | 2 | $0.12 |
| 6 | 47 nF Capacitor | HSC Electronics | NA | 1 | $0.12 |
| 7 | 2.2 μF Capacitor | HSC Electronics | NA | 1 | $0.12 |
| 8 | 10 μF Capacitor | HSC Electronics | NA | 1 | $0.12 |
| 9 | 10 kΏ Resistor | HSC Electronics | NA | 2 | $0.10 |
| 10 | 11 kΏ Resistor | HSC Electronics | NA | 1 | $0.10 |
| 11 | 100 kΏ Resistor | HSC Electronics | NA | 5 | $0.10 |
| 12 | 221 kΏ Resistor | HSC Electronics | NA | 2 | $0.10 |
| 13 | 22 MΏ Resistor | HSC Electronics | NA | 4 | $0.10 |
| 14 | Diode | HSC Electronics | NA | 1 | NA |
| 15 | OPAMP | HSC Electronics | LN324N | 1 | NA |
| 16 | Twin Through-hole Protoboard | Fry's Electronics | NA | 1 | $20.00 |
| 17 | Wire Wrapping Wires | Fry's Electronics | NA | NA | NA |
| 18 | Female and male Jumper Wires | Fry's Electronics | NA | NA | NA |
| 19 | MC7805CT Voltage Regulator | HSC Electronics | NA | NA | NA |
| 20 | DC Input | HSC Electronics | NA | NA | NA |
| 21 | SJOne Board | Preet | NA | NA | $80 |
Design & Implementation
Hardware Design
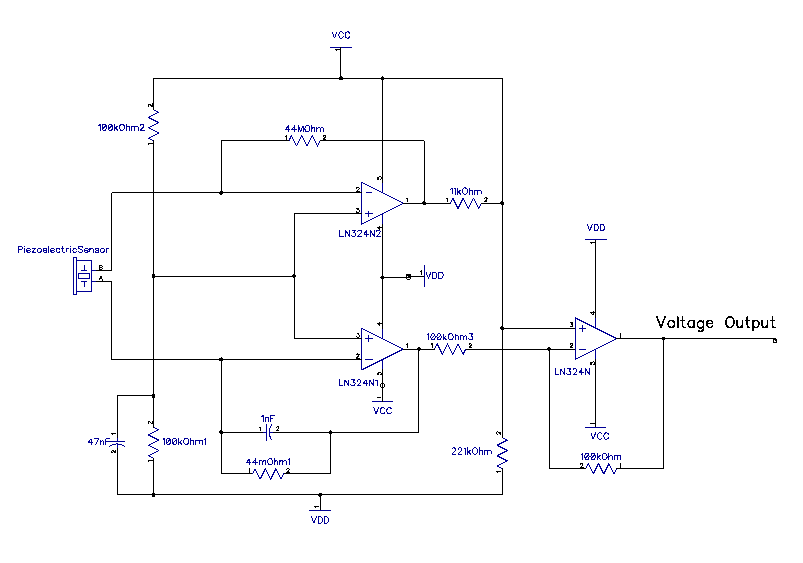
The seismograph is constructed using two separate circuits. The first circuit illustrated below labeled Seismograph Circuit is the sensor circuit which detects an earthquake and creates a voltage. This is done by a piezoelectric sensor that generates a millivolt signal whenever a vibration or seismic activity is detected. The piezoelectric sensor has a positive and negative terminal, which connect both terminals directly to the LM324N amplifying circuit.
We created two amplifying circuits with feedback to intensify the signal that is generated to approximately 2.5 volts. When the signal is first made it is too small to be read by the ADC hardware thus we needed to step up the voltage to a more applicable range. At this stage the voltage varies from 2.5 volts at a steady state when no seismic activity is detected. Once a vibration occurs causing the piezoelectric sensor to vibrate, the voltage will drop to approximately 0 volts. A low pass filters is used to reduce noise from the signal so we can receive a clean seismic signal when a vibration is felt by the piezoelectric sensor. The output of this portion of the circuit is an AC output which has a positive and negative direction for voltage. It is unfavorable to use this signal thus we use a rectifying circuit to create a steady DC voltage output.
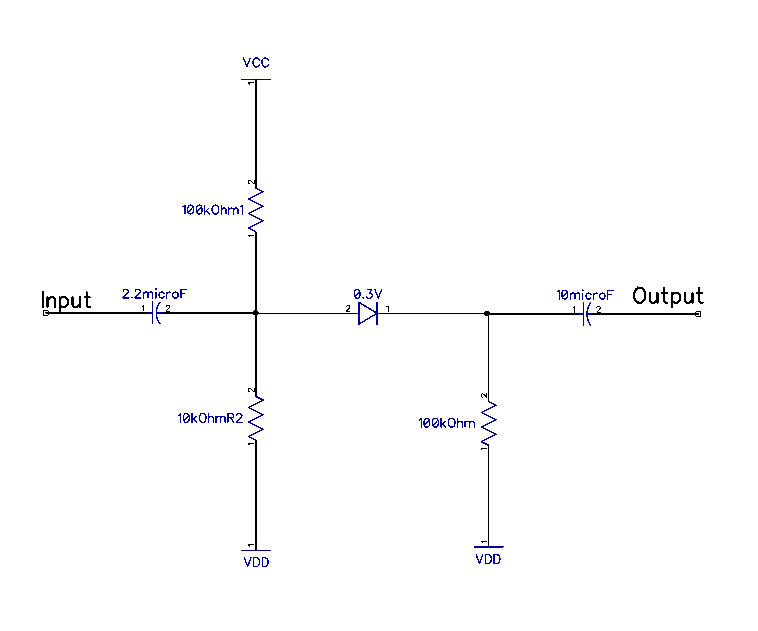
The second circuit is a rectifying circuit which takes in the 2.5 volt output that is generated from the Seismograph Circuit. The purpose of this circuit is to cut off the negative voltage and create only a positive voltage. This voltage that is outputted is what we connect directly into our A2D converter which is developed in the SJONE board. Once the voltage goes through this rectifying circuit, we are left with a zero volt output which raises whenever a seismic activity is felt.
The following figure illustrated below is a complete pin schematic of the entire seismograph.
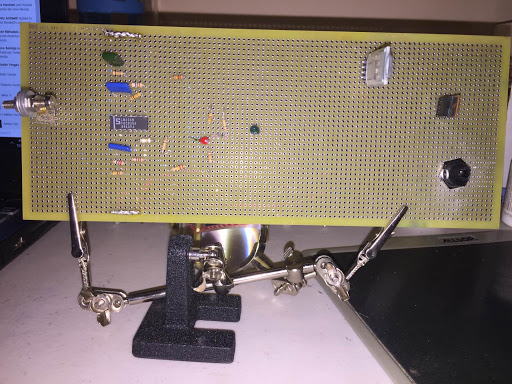
The following picture illustrates below is the wirewrapped seismograph board.
Hardware Interface
When constructing the Seismograph, we needed to incorporate many system interfaces for communcation between the different modules. The following interfaces and technologies were used in constructing the Seismograph and are illustrated below.
Technologies Used
Mobile Application
- Apache Cordova
- GeoLocation
- Bluetooth
Protocols, Hardware, and Peripherals
- SPI
- UART
- Bluetooth
- ADC
- 1.8" TFT LCD Screen
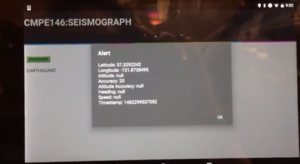
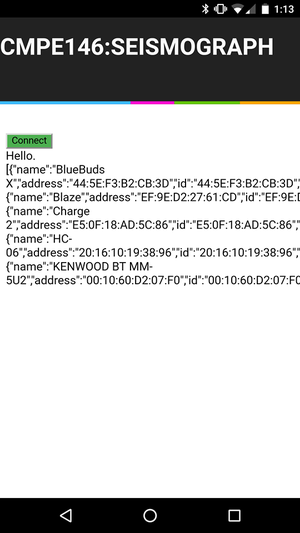
Apache Cordova is the framework used to construct the android app for the seismograph. The androids app main purpose to connect directly to the HC-06 Bluetooth module using a Bluetooth communication. Once the communication is established, messages can be sent back and forth between the SJONE board using UART communication which is then converted directly into a Bluetooth signal. We implemented this feature into the seismograph to allow for the SJONE board to determine the GPS location of the host user and relay it back when an earthquake happens.
The 4-line SPI interface was used to communicate between the SJONE board and the Adafruit LCD shield. The purpose of this interface is to initialize the board with startup configurations such as register setup and to send the earthquake data to the LCD to be drawn for a graphical representation. When we designed the hardware driver for the SPI communication we used SSP1 and used the following pins for each configuration as illustrated below in the table.
| Function | SJONE Pin | Adafruit LCD Pin |
|---|---|---|
| MOSI | MOSI1 | Pin 11 DO |
| MISO | MISO1 | Pin 12 DI |
| SCLOCK | SCK1 | Pin 13 SCK |
| Chip Select | Port 0.0 | Pin 10 TCS |
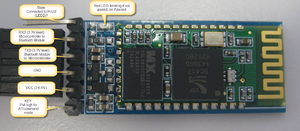
The UART communication was implemented to communicate between the SJONE board and the HC-06 Bluetooth module. This was done using a 9600 bps baud rate with the basic configuration. We use the UART communication to send data back and forth between the HC-06 Bluetooth module. The Bluetooth modules main purpose is to be able to connect directly wireless through a Bluetooth communication to our android phone app. Once an earthquake is detected from the seismograph, the SJONE board will send data directly using the UART communication to the HC-06 at which will be sent directly through the Bluetooth link between the HC-06 and the cellular android phone. The pin configuration between the SJONE board and the HC-06 Bluetooth module are illustrated below in the table.
| Function | SJONE Pin | HC-06 Bluetooth Pin |
|---|---|---|
| RX>TX | RX02 | TX |
| TX>RX | TX02 | RX |
The analog-to-digital converter was implemented to interpret an analog signal that is generated from our seismograph circuit. This circuit will take in a voltage range from 0 volts to 2.5 volts and convert it into a 12-bit hexadecimal value. This is how we interpret when seismic activity occurs and make sense of the data to the SJONE board. The pin configuration between the SJONE board with the built in ADC is illustrated below in the table.
| Function | SJONE Pin | Seismograph Circuit |
|---|---|---|
| ADC | Port 1.31 | Vout |
Software Design
The software design consists of 3 main tasks. The LCD task, ADC task, and the Bluetooth task. The ADC task continuously samples data from the seismograph and converts the analog signal to its digital counterpart. It then writes the data received along with a running time stamp (given in ms). The data was divided to an 8 bit value to scale it down for plotting on the LCD screen. The time stamp and the ADC value make up one (x,y) plot on the screen where timestamp is our x value and our 8 bit digital value is our y value. Lastly, the Bluetooth task waits for a signal from the ADC task to send a message to a mobile application.
LCD Task
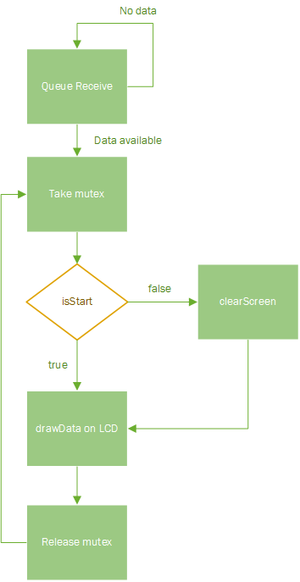
The LCD task handles all of the drawing of the seismograph data to screen. Below is a flowchart of the design used. The LCD task uses SPI protocol to send data received from the queue to be drawn onto the screen.
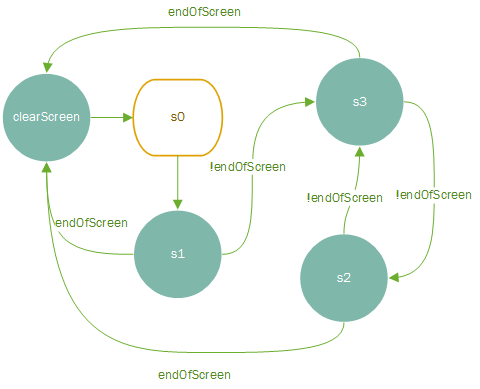
The LCD task follows the diagram above and to prevent wrapping and drawing over previous data, we clear the screen when it is at the end and continue drawing. The LCD task uses an internal state machine to draw lines between the points. It takes the initial x0,y0 value and draws a point to the next x1,y1 point. When it continues, it makes the last point the new starting point and continues to draw as it receives values.
The steps to draw pixels to the LCD screen are as follows:
Set the address window:
- Send CASET command
- Send the column address value (this is our x value)
- Send command opcode
- Send the row address value (our y value)
- Send the RAMWR command to write to the LCD memory
Set the pixel:
- Send the RAMWR command
- Send our RGB 565 color value
Each time a command is sent, the our DC pin is cleared since it indicates that the value sent is a command. When we send our data, we pull the pin high by setting it to indicate we are sending data.
As described in the Testing and Technical Challenges section under Working with the ST7735: Setting Our Origin Point the column and row addresses are swapped because it was originally intended for portrait display.
ADC Task
The ADC task converts the data from the seismograph to a digital value and stores it into the SD card as well as providing the value via the freeRTOS queue to the LCD task.
A mutex was necessary since both writing to the SD card and LCD screen use SSP1 for transferring data.
The data stored on the SD card is in the format (time, ADC value).
Suggestion: API for ADC is provided under adc.c and could have been used.
Bluetooth Task
The Bluetooth task is used to send an "Earthquake" message to a mobile application via UART. It utilizes a binary semaphore that gets triggered when an earthquake with a value above hex 0xB00 is detected.
The mobile application has an event listener that waits to receive a newline (\n) via UART. When it receives it, it prints the message that follows and then brings up an alert window that displays the current GPS location.
Implementation
Our overall system implementation consists of the following steps:
- The seismograph sends data to the SJOne board that gets converted to a digital value
- The 12 bit ADC value is checked to see if it is equal or greater than 0xB00 (this value was obtained through expirementation). If it is true, it signals the bluetooth task to send out the earthquake message via UART.
- If the mobile application receives an earthquake message, an alert appears on the screen with the GPS coordinate information
- The value is sent to a shared queue
- The LCD task receives values from the queue and following its state machine, it draws the values to the screen
Testing & Technical Challenges
Working with the ST7735
Poor Documentation
There were problems initializing the LCD screen due to poor documentation. The only provided documentation for the screen itself was given in Chinese so it was very difficult for us to figure out how much voltage the screen required for power on. In order to figure this out, we connected an Arduino and cross referenced each pin and voltage that was required to power on the screen. We ended up having to read through code originally intended to work for the Arduino to understand the initialization process of the LCD screen.
Setting Our Origin Point
The ST7735 appears to originally be configured to be used in portrait mode with origin located at the upper left hand corner. In order for us to use draw in landscape with the (0,0) pixel at the bottom left hand corner, we swapped the width and height values (originally 128x160). We then found that it still did not start where we expected it to but instead, the (0,0) mark was on the top left hand corner in landscape view. So, when we drew the pixels, we subtracted the y value by 127 to shift the values down.
Continuous Real-time Drawing
We needed a way to have our LCD screen continuously draw between x,y points we received. We began with points but found it difficult when we needed to draw a line from point to point. In order to help with this, we created a state machine that runs internally to the LCD task. This way, the last x,y points were taken as the new current x,y point to have a continuous line.
Bus Contention Issues
Since both the LCD screen and the SD card were using SSP1 for SPI communication, we had issues where the LCD screen would suddenly turn to an all white screen. We came to the conclusion that since they were using the same lines, there was bus contention. In order to solve this problem, we utilized a mutex to ensure that only one of the tasks was utilizing the line at any given time.
Conclusion
In conclusion, we were able to successfully complete our project. We built a working seismograph and interfaced it with multiple components utilizing the different communication protocols we learned in lab. This project helped solidify our knowledge and understanding of not only how important datasheets are, but how important it is to read them and understand how to read them. We found that due to poor documentation, it made it very difficult for us to actually get things working in a timely manner. We ended up sinking a great amount of time trying to figure out how to initialize the LCD screen and what voltages it expected to even turn it on. In the end, we learned a great deal implementing our project and were able to solidify our understanding of many of the things we learned during our laboratory lectures.
Improvements
In the future, we would improve on this project by implementing a joystick that would allow us to scroll through the data history. A great deal of research was done to try to get this working. We were able to detect the movements of the joystick but realized too late that we were unable to use the ADC at the same time as the seismograph. This is because, as stated in the manual, when using a software ADC, you can only have values converted in one channel at a time. This meant that we would need to use interrupts to use multiple channels. We also came to the realization too late that these interrupts are actually already implemented in the API provided to us in adc.c. This is a great example of "never reinvent the wheel" and to always read thoroughly any documentation for any limitations.
In addition, the project could be greatly improved upon if we were able to do extra research in getting accurate readings. Essentially, how do we know what voltage corresponds to what magnitude earthquake? In this project, we had to make some estimations and testing based off trial and error to find a value that fit, but we could increase the accuracy of this design through further testing and research.
In terms of the mobile application, it currently just receives a message and prints it to screen and a pop up appears with the GPS location. In reality, this would be useless. It would be far more useful to be able to integrate this application with another social media platform like Twitter or Facebook to allow loved ones to know where you are and for people to be able to respond whether they are safe.
Project Video
Project Source Code
References
Acknowledgement
A special thank you to the following individuals for their help, guidance, and answering our never-ending array of questions:
- Preetpal Kang
- Praveen Prabhakaran
- Charles MacDonald
- Dr. Ozemek
References Used
List any references used in project.
- ST7735 Datasheet
- Building A Seismograph
- Apache Cordova Documentation
- LPC176x/5x User Manual
- LPC1758 SJOne Board Rev4 Schematics
- freeRTOS Documentation
