Difference between revisions of "F16: Seismograph"
m (→Software Design) |
m (→Project Title) |
||
| Line 12: | Line 12: | ||
== Project Title == | == Project Title == | ||
| − | Seismograph | + | <center><big>Seismograph</big></center> |
| + | |||
== Abstract == | == Abstract == | ||
In recent years, news of an upcoming large scale earthquake in California has been increasing. Having a seismograph would allow us to directly see any seismic activity. In addition, by adding an LCD screen, we would be able to add plots of the data in a time series manner for any research purposes. Most importantly, the seismograph device would allow to help with search and rescue efforts. When a large scale earthquake is detected, it would allow a signal to be detected via your cellphone in order to ping your GPS location in case of a building collapse. | In recent years, news of an upcoming large scale earthquake in California has been increasing. Having a seismograph would allow us to directly see any seismic activity. In addition, by adding an LCD screen, we would be able to add plots of the data in a time series manner for any research purposes. Most importantly, the seismograph device would allow to help with search and rescue efforts. When a large scale earthquake is detected, it would allow a signal to be detected via your cellphone in order to ping your GPS location in case of a building collapse. | ||
Revision as of 06:12, 20 December 2016
Contents
Grading Criteria
- How well is Software & Hardware Design described?
- How well can this report be used to reproduce this project?
- Code Quality
- Overall Report Quality:
- Software Block Diagrams
- Hardware Block Diagrams
- Schematic Quality
- Quality of technical challenges and solutions adopted.
Project Title
Abstract
In recent years, news of an upcoming large scale earthquake in California has been increasing. Having a seismograph would allow us to directly see any seismic activity. In addition, by adding an LCD screen, we would be able to add plots of the data in a time series manner for any research purposes. Most importantly, the seismograph device would allow to help with search and rescue efforts. When a large scale earthquake is detected, it would allow a signal to be detected via your cellphone in order to ping your GPS location in case of a building collapse.
Objectives & Introduction
Our seismograph would help bring awareness to the realities of earthquakes in California. In addition, it has the possibility to help save lives by aiding in search and rescue efforts when a large earthquake does come.
- Create a working seismograph and store data onto a microSD card
- Write software to display data onto an LCD screen
- Add to software to send signals to cellphone via Bluetooth
- Write a small mobile application to receive data via Bluetooth
Team Members & Responsibilities
Both team members will be working on all areas of development with specific focuses as follows:
- Mina Yi
- Focus on software
- Display data on LCD screen
- Mobile application to recognize signal
- Focus on software
- Andrew Ahwal
- Focus on hardware portion to build a working seismograph
Schedule
- Responsibility and leadership of the task is indicated by the Assignee.
- However, it does not mean that they will be expected to complete the tasks alone.
- Subtasks are listed in the comments section and are numbered.
- Subtasks will be delegated as seen fit.
- Any deviation to the schedule due to technical issues will be covered under the Testing & Technical Challenges section.
NOTE: Documentation is not specifically listed in our project schedule. However, each task has a documentation phase before and after each task.
| Task# | Start Date | End Date | Task | Assignee | Status | Date Completed | Comments |
|---|---|---|---|---|---|---|---|
| 1 | 10/30 | 11/12 | Order components | Both | Complete | 11/6 | |
| 2 | 10/31 | 11/7 | Read datasheets & research | Both | Complete | 11/7 | |
| 3 | 11/6 | 12/1 | Interfacing Bluetooth | Mina | Complete | 12/17 | 1. Set up development environment
2. Create the mobile application 3. Interface SJOne board with the application 4. Send notification via bluetooth |
| 4 | 11/6 | 11/17 | Build Seismograph circuit | Andrew | Complete | Circuit 11/13 | Expected circuit completion date: 11/14
Expected testing dates: 11/14 - 11/17 |
| 5 | 11/18 | 11/18 | Progress update | Both | Complete | 11/18 | In class demo of our progress. |
| 6 | 11/18 | 11/20 | Interface seismograph circuit with SJOne board | Andrew | Complete | 11/20 | |
| 7 | 11/21 | 12/7 | Integrate LCD screen with SJOne board & seismograph | Mina | Complete | 12/17 | 1. Fetch data created by the seismograph
2. Display data on the LCD screen |
| 8 | 12/7 | 12/20 | Testing and tweaking finalized product | Both |
Parts List & Cost
| Part # | Part Name | Purchase Location | Part Specification | Quantity | Cost per item |
|---|---|---|---|---|---|
| 1 | Piezoelectric Vibration Sensor With Mass | wwww.sparkfun.com | Sen-09197 | 1 | $2.95 |
| 2 | MicroSD | Frys Electronics | 16GB | 1 | $9.99 |
| 3 | Adafruit 1.8" Color TFT Shield w/microSD and Joystick | www.Amazon.com | NA | 1 | $34.99 |
| 4 | HC-06 Bluetooth Module | www.Amazon.com | NA | 1 | $8.99 |
| 5 | 1 nF Capacitor | HSC Electronics | NA | 2 | $0.12 |
| 6 | 47 nF Capacitor | HSC Electronics | NA | 1 | $0.12 |
| 7 | 2.2 μF Capacitor | HSC Electronics | NA | 1 | $0.12 |
| 8 | 10 μF Capacitor | HSC Electronics | NA | 1 | $0.12 |
| 9 | 10 kΏ Resistor | HSC Electronics | NA | 2 | $0.10 |
| 10 | 11 kΏ Resistor | HSC Electronics | NA | 1 | $0.10 |
| 11 | 100 kΏ Resistor | HSC Electronics | NA | 5 | $0.10 |
| 12 | 221 kΏ Resistor | HSC Electronics | NA | 2 | $0.10 |
| 13 | 22 MΏ Resistor | HSC Electronics | NA | 4 | $0.10 |
| 14 | Diode | HSC Electronics | NA | 1 | NA |
| 15 | OPAMP | HSC Electronics | LN324N | 1 | NA |
| 16 | Twin Through-hole Protoboard | Fry's Electronics | NA | 1 | NA |
| 17 | Various wires | Fry's Electronics | NA | NA | NA |
Design & Implementation
The design section can go over your hardware and software design. Organize this section using sub-sections that go over your design and implementation.
Hardware Design
Discuss your hardware design here. Show detailed schematics, and the interface here.
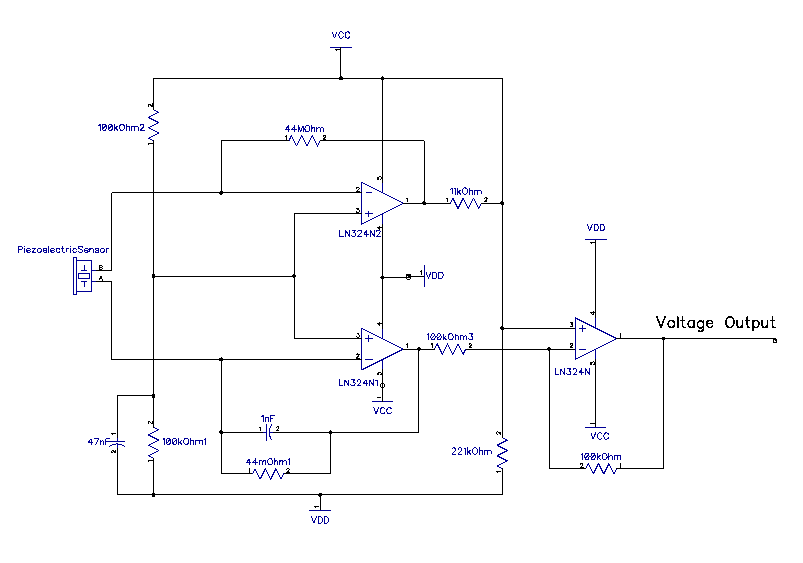
(I am going to write about this section once I better understand how op-amp works The seismograph is constructed using two separate circuits. The first circuit illustrated below as Seismograph Circuit is what generates the voltage. This is done by a piezoelectric sensor that generates millivolts whenever a vibration or seismic activity is detected. The piezoelectric sensor has a positive and negative terminal, which connect both terminals directly to the LM324N amplifying circuit.
At this stage the voltage varies from 2.5 volts at a steady state when no seismic activity is detected. Once a vibration happens causing the piezoelectric sensor to vibrate, the voltage will drop to approximately 0 volts.
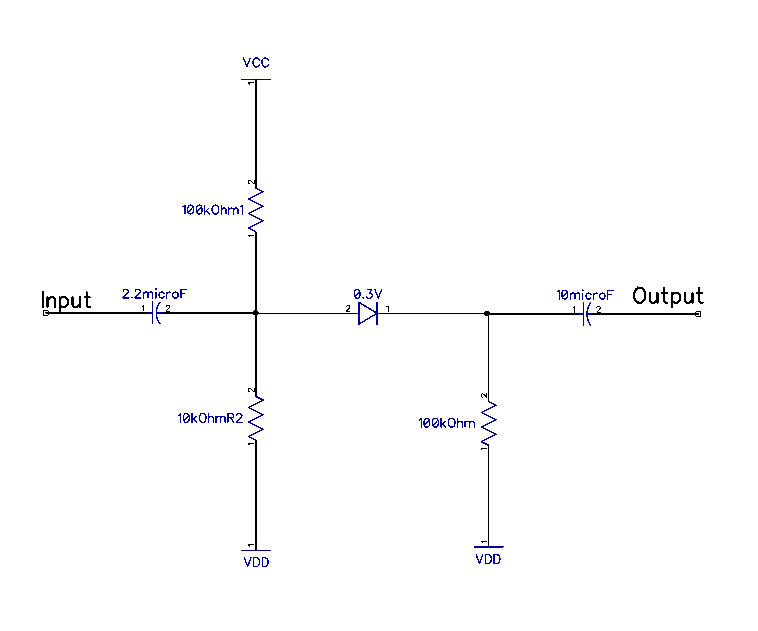
The second circuit is a rectifying circuit which takes in the 2.5 volt output that is generated from the Seismograph Circuit. This circuits purpose is to cut off the negative voltage and create only a positive voltage. This voltage that is outputted is what we connect directly into our A2D converter which is developed in the SJONE board.
Hardware Interface
In this section, you can describe how your hardware communicates, such as which BUSes used. You can discuss your driver implementation here, such that the Software Design section is isolated to talk about high level workings rather than inner working of your project.
Software Design
Show your software design. For example, if you are designing an MP3 Player, show the tasks that you are using, and what they are doing at a high level. Do not show the details of the code. For example, do not show exact code, but you may show psuedocode and fragments of code. Keep in mind that you are showing DESIGN of your software, not the inner workings of it.
The software design consists of 3 main tasks. The LCD task, ADC task, and the Bluetooth task. The ADC task continuously samples data from the seismograph and converts the analog signal to its digital counterpart. It then writes the data received along with a running time stamp (given in ms). The data was divided to an 8 bit value to scale it down for plotting on the LCD screen. The time stamp and the ADC value make up one (x,y) plot on the screen where timestamp is our x value and our 8 bit digital value is our y value. Lastly, the Bluetooth task waits for a signal from the ADC task to send a message to a mobile application.
LCD Task
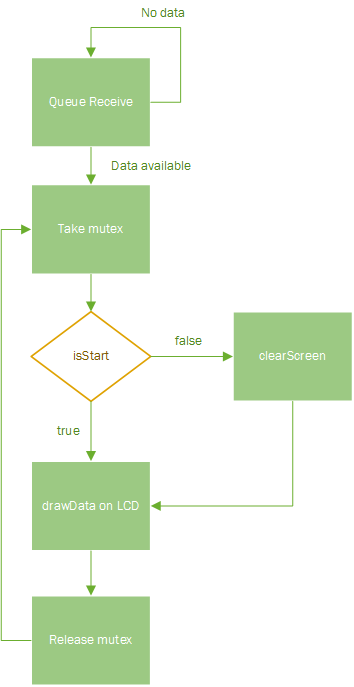
The LCD task handles all of the drawing of the seismograph data to screen. Below is a flowchart of the design used.
ADC Task
The ADC task converts the data from the seismograph to a digital value and stores it into the sd card as well as providing the value via the freeRTOS queue to the LCD task. A mutex was necessary since both writing to the SD card and LCD screen use SSP1 for transferring data. Suggestion: API for ADC is provided under adc.c and should be used instead
Bluetooth Task
The Bluetooth task is used to send an "Earthquake" message to a mobile application.
Implementation
This section includes implementation, but again, not the details, just the high level. For example, you can list the steps it takes to communicate over a sensor, or the steps needed to write a page of memory onto SPI Flash. You can include sub-sections for each of your component implementation.
Testing & Technical Challenges
Documentation Issues
One of the largest deterrents in our project was due to poor or little to no documentation.
Working with the ST7735
There were problems initializing the LCD screen since the documentation was not very helpful. In addition, the board was originally intended to be used with an Arduino so we had to port the Arduino code over to work with our board.
HC-06 Bluetooth Module
Bus Contention Issues
Conclusion
Conclude your project here. You can recap your testing and problems. You should address the "so what" part here to indicate what you ultimately learnt from this project. How has this project increased your knowledge?
Project Video
Upload a video of your project and post the link here.
Project Source Code
References
Acknowledgement
References Used
List any references used in project.
Appendix
You can list the references you used.


